Bitcoin price again failed to clear the $38,000 resistance zone. BTC is likely forming a double top and might decline toward the $34,500 support.
Bitcoin started a fresh decline from the $38,000 resistance zone.
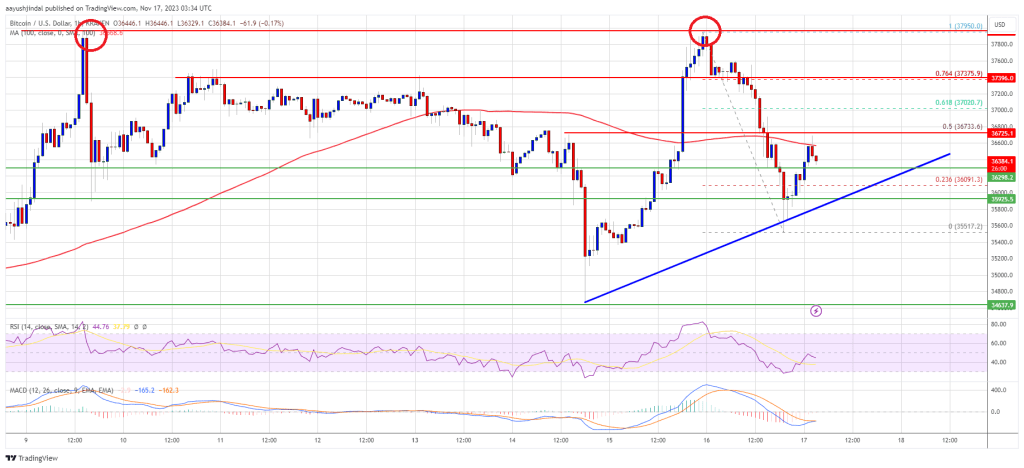
The price is trading below $36,750 and the 100 hourly Simple moving average.
There is a connecting bullish trend line forming with support near $36,250 on the hourly chart of the BTC/USD pair (data feed from Kraken).
The pair could decline further if there is a break below the $35,950 support.
Bitcoin price made another attempt to clear the $38,000 resistance. However, BTC failed to clear the $38,000 resistance and started a fresh decline. It seems like the price is forming a double-top pattern near the $38,000 zone.
There was a sharp move below the $37,200 and $37,000 levels. The price even spiked below the $36,500 level and the 100 hourly Simple moving average. Finally, the bulls appeared near the $35,500 level. A low was formed near $35,517 and the price is now correcting losses.
The price climbed above the 23.6% Fib retracement level of the downward move from the $37,950 swing high to the $35,517 low. Bitcoin is now trading below $36,750 and the 100 hourly Simple moving average. There is also a connecting bullish trend line forming with support near $36,250 on the hourly chart of the BTC/USD pair.
On the upside, immediate resistance is near the $36,700 level. The next key resistance could be near $37,000 or 61.8% Fib retracement level of the downward move from the $37,950 swing high to the $35,517 low.
Source: BTCUSD on TradingView.com
A close above the $37,000 resistance could start a strong increase. The first major resistance is near $37,500, above which the price might accelerate further higher. In the stated case, it could test the $38,000 level. Any more gains might send BTC toward the $39,200 level.
If Bitcoin fails to rise above the $37,000 resistance zone, it could continue to move down to complete the double-top pattern. Immediate support on the downside is near the $36,200 level.
The next major support is $36,000. If there is a move below $36,000, there is a risk of more downsides. In the stated case, the price could drop toward the $35,500 support in the near term. The next key support or target could be $34,500.
Technical indicators:
Hourly MACD – The MACD is now losing pace in the bullish zone.
Hourly RSI (Relative Strength Index) – The RSI for BTC/USD is now below the 50 level.
Major Support Levels – $36,200, followed by $35,500.
Major Resistance Levels – $36,700, $37,000, and $38,000.
[#item_full_content]NewsBTCRead MoreMetaplanet, Asia's largest publicly traded holder of bitcoin, is currently deep in the red, with…
A brutal crypto selloff erased $2.6 billion in leveraged bets, sent bitcoin to $60,000 and…
Your day-ahead look for Feb. 6, 2026Read MoreCoinDesk: Bitcoin, Ethereum, Crypto News and Price Data[#item_full_content]
Earnings disappointments weigh on AI related tech, while crypto sentiment improves on bitcoin’s rebound.Read MoreCoinDesk:…
Bitcoin’s role in big-money talks has shifted in recent weeks. Reports say analysts at JPMorgan…
What to Know: Metaplanet’s aggressive Bitcoin accumulation strategy confirms a growing trend of corporate treasury…