Bitcoin price started a fresh decline from the $62,000 resistance zone. BTC is declining and remains at a risk of more losses below the $60,000 level.
Bitcoin started a fresh decline after it failed near $62,000.
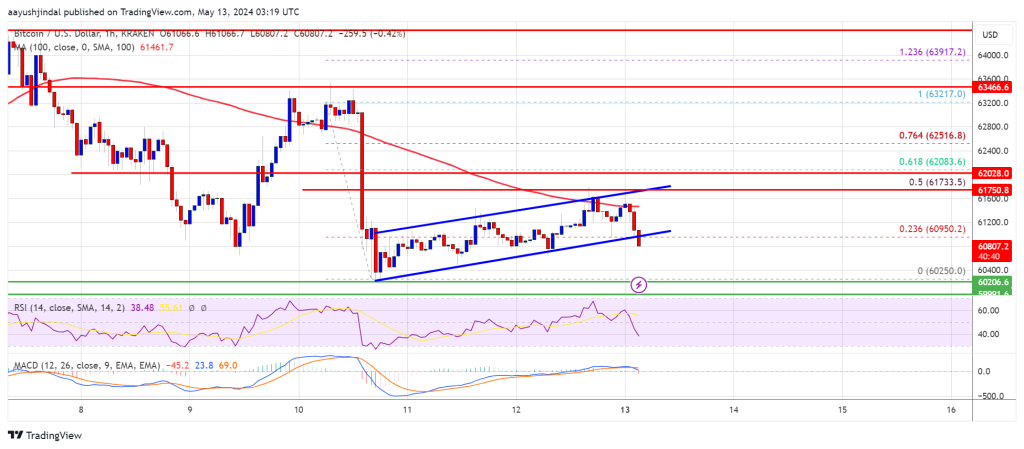
The price is trading below $61,000 and the 100 hourly Simple moving average.
There was a break below a bearish flag pattern with support near $60,950 on the hourly chart of the BTC/USD pair (data feed from Kraken).
The pair could gain bearish momentum if there is a close below the $60,000 level.
Bitcoin price found support near the $60,250 zone and started a recovery wave. BTC was able to recover above the 23.6% Fib retracement level of the downward move from the $63,217 swing high to the $60,250 low.
However, the bears were active near the $61,800 resistance zone. They defended the 50% Fib retracement level of the downward move from the $63,217 swing high to the $60,250 low. There was a fresh bearish reaction below the $61,200 support zone.
There was a break below a bearish flag pattern with support near $60,950 on the hourly chart of the BTC/USD pair. Bitcoin is now trading below $61,000 and the 100 hourly Simple moving average.
Immediate resistance is near the $61,200 level. The first major resistance could be $62,000 or the 100 hourly Simple moving average. The next key resistance could be $62,500. A clear move above the $62,500 resistance might send the price higher.
Source: BTCUSD on TradingView.com
The main resistance now sits at $63,500. If there is a close above the $63,500 resistance zone, the price could continue to move up. In the stated case, the price could rise toward $65,000.
If Bitcoin fails to climb above the $61,200 resistance zone, it could continue to move down. Immediate support on the downside is near the $60,500 level.
The first major support is $60,000. If there is a close below $60,000, the price could start to drop toward $58,500. Any more losses might send the price toward the $56,650 support zone in the near term.
Technical indicators:
Hourly MACD – The MACD is now gaining pace in the bearish zone.
Hourly RSI (Relative Strength Index) – The RSI for BTC/USD is now below the 50 level.
Major Support Levels – $60,500, followed by $60,000.
Major Resistance Levels – $61,200, $62,200, and $62,500.
[#item_full_content]NewsBTCRead MoreOn-chain data shows the Bitcoin sharks and whales have seen their population grow during the…
Bitcoin (BTC) has settled back into the familiar consolidation band between roughly $65,000 and $74,000…
Whale wallets quietly shifted to buying mode over the past two weeks — even as…
A crypto analyst has broken down everything investors and traders need to know about the…
Bitcoin Magazine Phong Le Calls Morgan Stanley’s BTC ETF a “Monster Bitcoin” Bet With $160…
For now, surging oil prices and persistent geopolitical tensions are driving inflation fears and weakening…