Bitcoin price started a decent increase above the $70,000 zone. BTC is now consolidating and might aim for more gains if it clears $72,000.
Bitcoin started a decent recovery wave above the $70,000 zone.
The price is trading above $70,000 and the 100 hourly simple moving average.
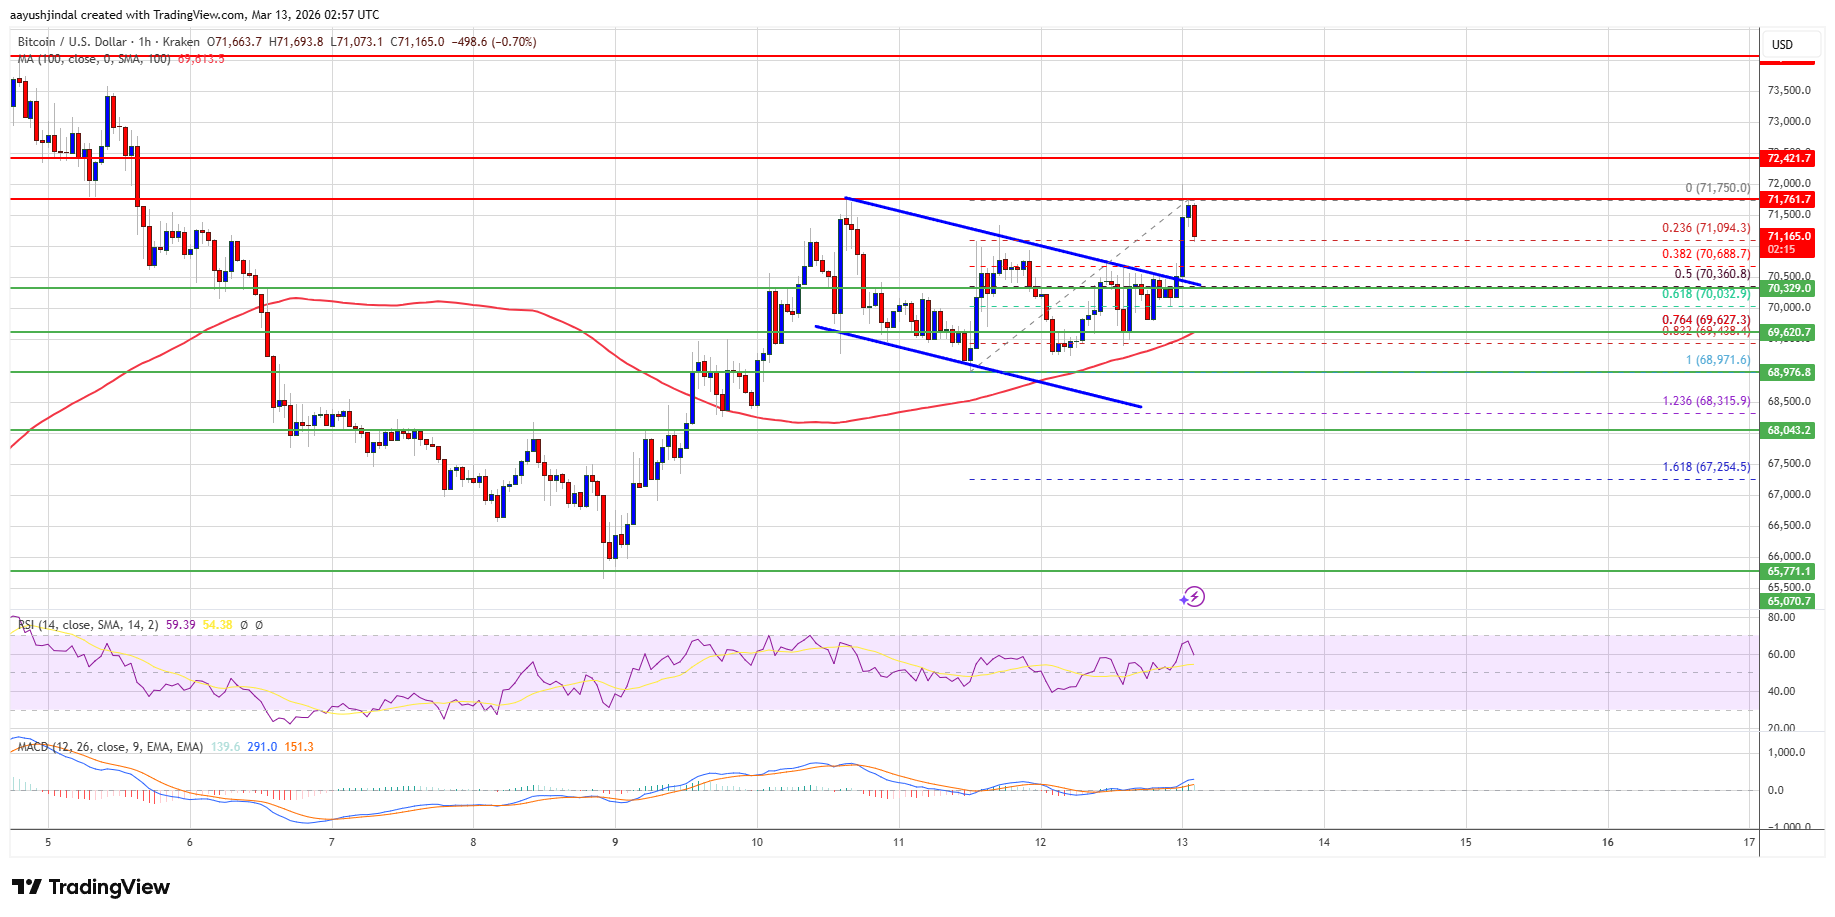
There was a break above a bullish flag with resistance at $70,500 on the hourly chart of the BTC/USD pair (data feed from Kraken).
The pair might dip again if it trades below the $70,400 and $70,000 levels.
Bitcoin price remained elevated and extended its increase above the $69,200 level. BTC climbed above the $69,500 and $70,000 resistance levels.
There was a break above a bullish flag with resistance at $70,500 on the hourly chart of the BTC/USD pair. The pair even climbed above the $71,000 level. A high was formed at $71,750, and the pair is now consolidating gains near the 23.6% Fib retracement level of the recent upward move from the $68,971 swing low to the $71,750 high.
Bitcoin is now trading above $70,800 and the 100 hourly simple moving average. If the price remains stable above $70,400, it could attempt a fresh increase. Immediate resistance is near the $71,750 level. The first key resistance is near the $72,000 level.
A close above the $72,000 resistance might send the price further higher. In the stated case, the price could rise and test the $73,200 resistance. Any more gains might send the price toward the $74,000 level. The next barrier for the bulls could be $75,000.
If Bitcoin fails to rise above the $71,750 resistance zone, it could start another decline. Immediate support is near the $70,400 level or the 50% Fib retracement level of the recent upward move from the $68,971 swing low to the $71,750 high. The first major support is near the $70,000 level.
The next support is now near the $68,800 zone. Any more losses might send the price toward the $67,250 support in the near term. The main support now sits at $66,500, below which BTC might struggle to recover in the near term.
Technical indicators:
Hourly MACD – The MACD is now gaining pace in the bullish zone.
Hourly RSI (Relative Strength Index) – The RSI for BTC/USD is now above the 50 level.
Major Support Levels – $70,400, followed by $70,000.
Major Resistance Levels – $71,750 and $72,000.
[#item_full_content]NewsBTCRead MoreBy Jonatan Randin, Senior Market Analyst at PrimeXBT In mid September the setup looked bad…
Bitcoin Magazine UK Chancellor of the Exchequer Blasts Nigel Farage’s ‘Bitcoin Account’ UK Chancellor of…
Bitcoin Magazine Strategy and Strive Scoop Up More Than 2,700 Bitcoin in a Week Bitcoin…
Bitcoin Magazine Dollars In, Bitcoin Out: Breez SDK Debuts New Stablecoin Feature Despite being so-called…
CoinDesk found 27 successful swaps moving about 2,390 ETH into 75.2 BTC, even as Bitget…
ZEC led losses among major tokens as Brent pushed toward $108 and traders added to…