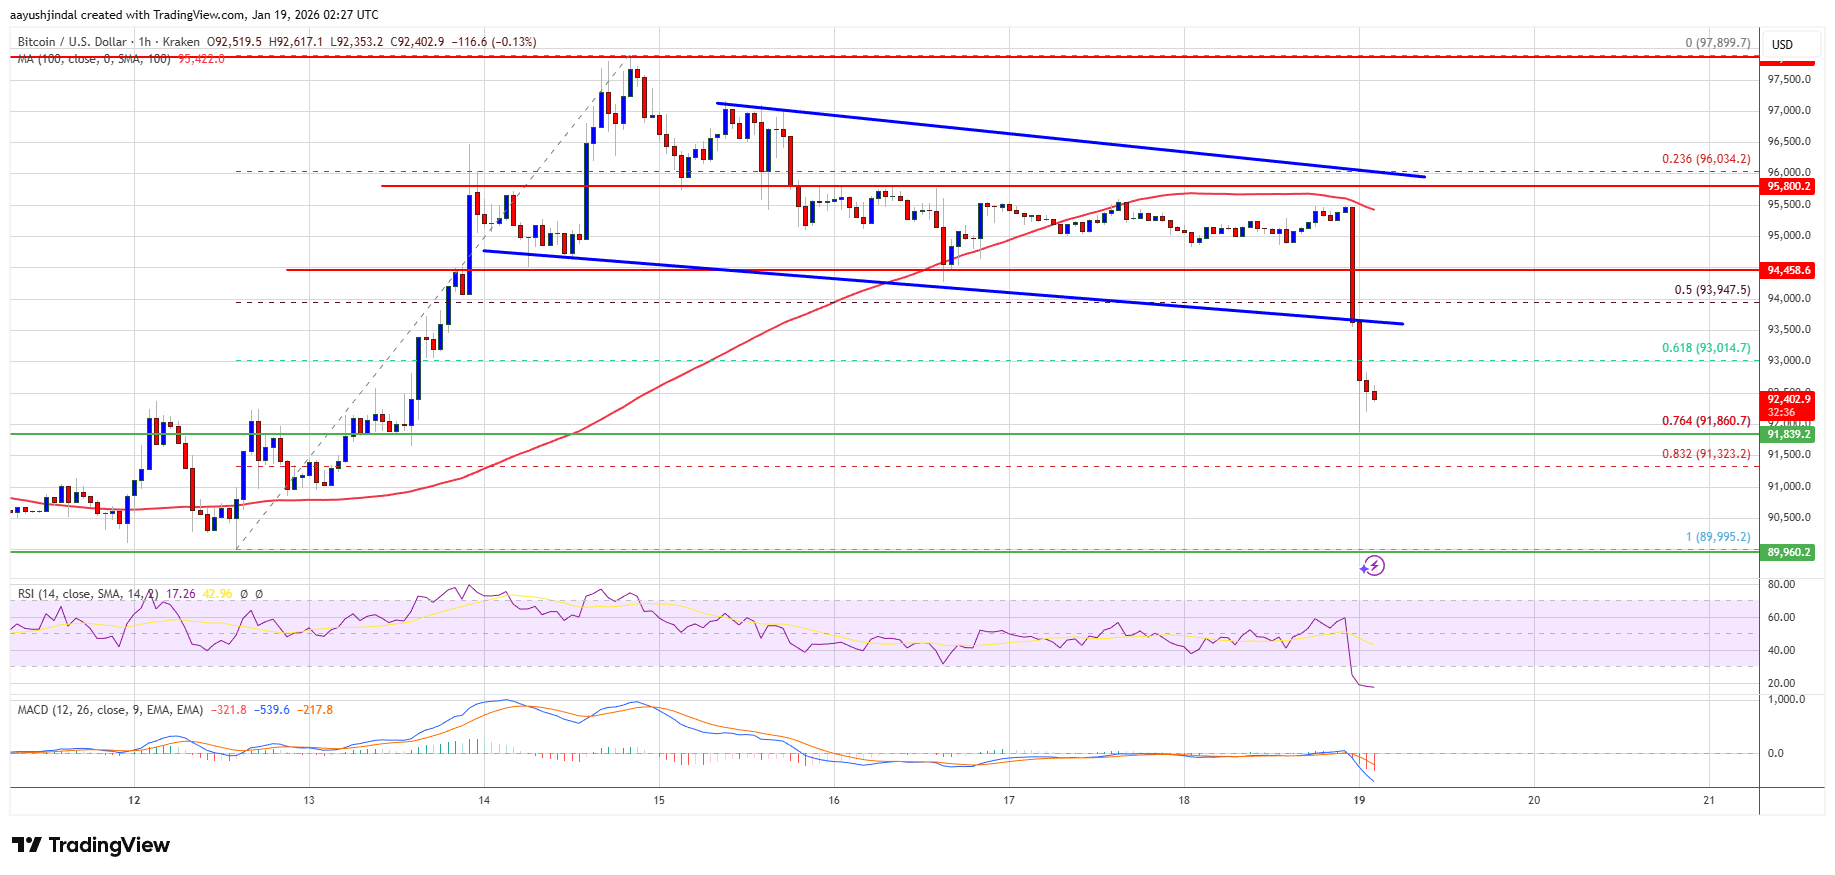
Bitcoin price started a fresh decline below $95,000. BTC is consolidating losses and remains at risk of more losses if it dips below $92,000.
Bitcoin started a sharp decline below $95,000 and $94,000.
The price is trading below $93,500 and the 100 hourly Simple moving average.
There was a break below a declining channel with support at $93,550 on the hourly chart of the BTC/USD pair (data feed from Kraken).
The pair might continue to move down if it stays below the $954000 zone.
Bitcoin price failed to stay above the $94,500 support and started a fresh decline. BTC declined sharply below the $94,000 and $93,500 support levels.
There was a move below the 61.8% Fib retracement level of the recent wave from the $89,995 swing low to the $97,898 high. Besides, there was a break below a declining channel with support at $93,550 on the hourly chart of the BTC/USD pair.
The price even spiked below $92,000. It tested the 76.4% Fib retracement level of the recent wave from the $89,995 swing low to the $97,898 high. Bitcoin is now trading below $93,500 and the 100 hourly Simple moving average.
If the price remains stable above $92,000, it could attempt a fresh increase. Immediate resistance is near the $93,000 level. The first key resistance is near the $93,500 level.
The next resistance could be $94,000. A close above the $94,000 resistance might send the price further higher. In the stated case, the price could rise and test the $95,000 resistance. Any more gains might send the price toward the $95,500 level. The next barrier for the bulls could be $96,200 and $96,400.
If Bitcoin fails to rise above the $93,500 resistance zone, it could start another decline. Immediate support is near the $92,000 level. The first major support is near the $91,800 level.
The next support is now near the $91,300 zone. Any more losses might send the price toward the $90,500 support in the near term. The main support sits at $90,000, below which BTC might accelerate lower in the near term.
Technical indicators:
Hourly MACD – The MACD is now losing pace in the bearish zone.
Hourly RSI (Relative Strength Index) – The RSI for BTC/USD is now below the 50 level.
Major Support Levels – $92,000, followed by $91,800.
Major Resistance Levels – $93,000 and $93,500.
[#item_full_content]NewsBTCRead MoreYour day-ahead look for July 3, 2026Read MoreCoinDesk: Bitcoin, Ethereum, Crypto News and Price Data[#item_full_content]
U.S. institutional demand had its worst month ever in June. Large holders absorbed the selling,…
Crypto ETF flows are starting to tell a more complicated story than simple risk-on or…
After dominating markets in 2026, AI-tied memory and semiconductor stocks are losing momentum, raising the…
Post ContentRead MoreCoinDesk: Bitcoin, Ethereum, Crypto News and Price Data[#item_full_content]
Spot ETFs had their strongest inflow day in two months, driven by funds other than…