Bitcoin price started a fresh decline below $95,000. BTC is consolidating losses and remains at risk of more losses if it dips below $92,000.
Bitcoin started a sharp decline below $95,000 and $94,000.
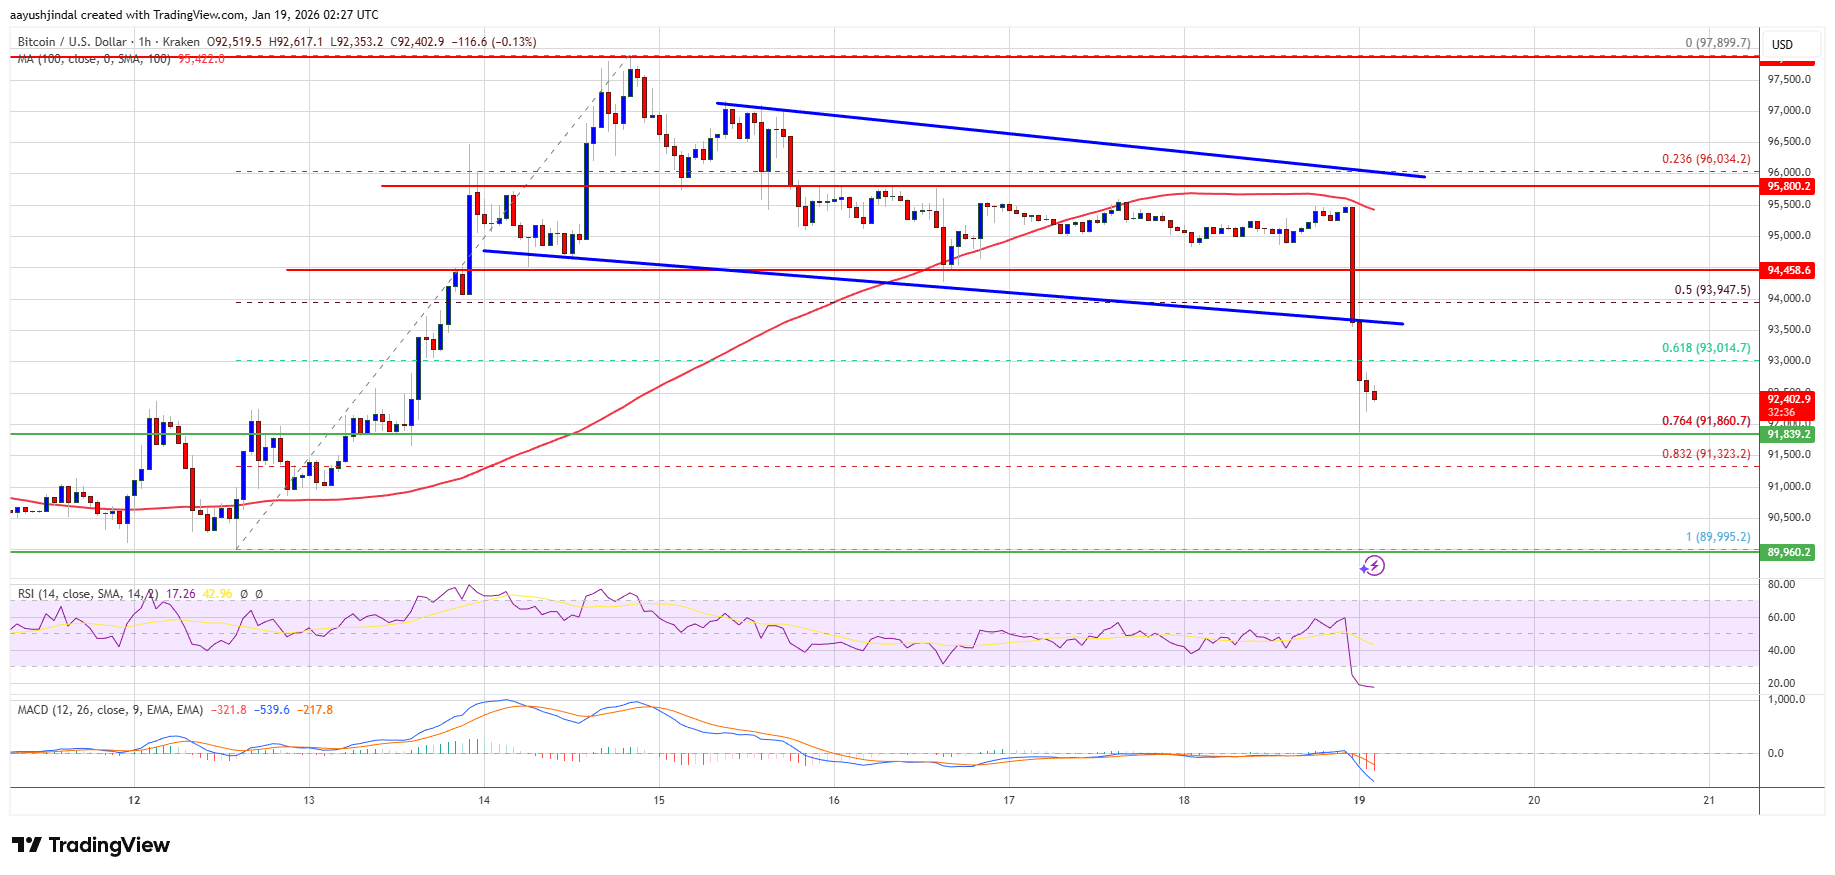
The price is trading below $93,500 and the 100 hourly Simple moving average.
There was a break below a declining channel with support at $93,550 on the hourly chart of the BTC/USD pair (data feed from Kraken).
The pair might continue to move down if it stays below the $954000 zone.
Bitcoin price failed to stay above the $94,500 support and started a fresh decline. BTC declined sharply below the $94,000 and $93,500 support levels.
There was a move below the 61.8% Fib retracement level of the recent wave from the $89,995 swing low to the $97,898 high. Besides, there was a break below a declining channel with support at $93,550 on the hourly chart of the BTC/USD pair.
The price even spiked below $92,000. It tested the 76.4% Fib retracement level of the recent wave from the $89,995 swing low to the $97,898 high. Bitcoin is now trading below $93,500 and the 100 hourly Simple moving average.
If the price remains stable above $92,000, it could attempt a fresh increase. Immediate resistance is near the $93,000 level. The first key resistance is near the $93,500 level.
The next resistance could be $94,000. A close above the $94,000 resistance might send the price further higher. In the stated case, the price could rise and test the $95,000 resistance. Any more gains might send the price toward the $95,500 level. The next barrier for the bulls could be $96,200 and $96,400.
If Bitcoin fails to rise above the $93,500 resistance zone, it could start another decline. Immediate support is near the $92,000 level. The first major support is near the $91,800 level.
The next support is now near the $91,300 zone. Any more losses might send the price toward the $90,500 support in the near term. The main support sits at $90,000, below which BTC might accelerate lower in the near term.
Technical indicators:
Hourly MACD – The MACD is now losing pace in the bearish zone.
Hourly RSI (Relative Strength Index) – The RSI for BTC/USD is now below the 50 level.
Major Support Levels – $92,000, followed by $91,800.
Major Resistance Levels – $93,000 and $93,500.
[#item_full_content]NewsBTCRead MoreBitcoin quietly gained ground while gold crumbled. That contrast has become one of the more…
Despite stabilizing spot prices, investors remain defensive, with leveraged speculation cooling and realized volatility dropping…
Crypto analyst Ardi has pointed to a bear market divergence to explain what has been…
Bitcoin is hovering near the $71,000 mark, consolidating after recent swings as the market digests…
First-quarter purchases have reached 89,618 BTC so far, the most since fourth-quarter 2024, and the…
Bitcoin (BTC) is showing early signs of a prolonged decline after peaking in October 2025.…