Bitcoin price extended losses and settled below $60,000. BTC is now consolidating losses near $58,000 and remains at risk of more downsides in the near term.
Bitcoin extended losses and traded below the $60,000 zone.
The price is trading below $59,000 and the 100 hourly Simple moving average.
There is a major bearish trend line forming with resistance at $58,000 on the hourly chart of the BTC/USD pair (data feed from Kraken).
The pair could continue to move down since there is a daily close below the $60,000 zone.
Bitcoin price remained in a bearish zone and traded below the $60,500 support level. BTC even settled below the $60,000 level to enter a short-term bearish zone.
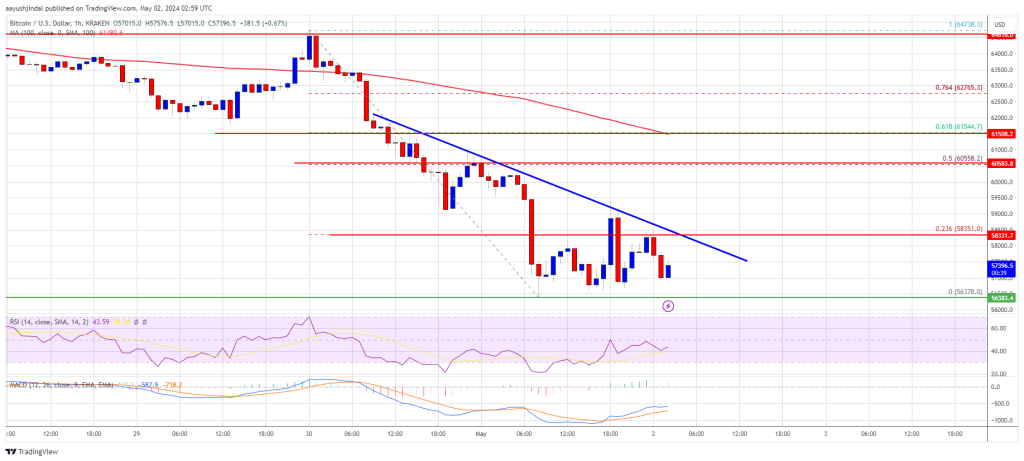
There was a drop below the $58,000 level. A low was formed at $56,378 and the price is now consolidating losses. There was a minor increase toward the $58,000 level and the 23.6% Fib retracement level of the downward move from the $64,740 swing high to the $56,378 low.
Bitcoin is now trading below $58,500 and the 100 hourly Simple moving average. Immediate resistance is near the $58,000 level. There is also a major bearish trend line forming with resistance at $58,000 on the hourly chart of the BTC/USD pair.
The first major resistance could be $59,200. The next key resistance could be $60,500 or the 50% Fib retracement level of the downward move from the $64,740 swing high to the $56,378 low.
Source: BTCUSD on TradingView.com
A clear move above the $60,500 resistance might send the price higher. The next resistance now sits at $61,500. If there is a clear move above the $61,500 resistance zone, the price could continue to move up. In the stated case, the price could rise toward $63,500.
If Bitcoin fails to rise above the $58,500 resistance zone, it could continue to move down. Immediate support on the downside is near the $57,000 level.
The first major support is $56,500. If there is a close below $56,500, the price could start to drop toward $55,000. Any more losses might send the price toward the $53,500 support zone in the near term.
Technical indicators:
Hourly MACD – The MACD is now gaining pace in the bearish zone.
Hourly RSI (Relative Strength Index) – The RSI for BTC/USD is now below the 50 level.
Major Support Levels – $57,000, followed by $56,500.
Major Resistance Levels – $58,500, $60,500, and $61,500.
[#item_full_content]NewsBTCRead MoreProminent analyst Darkfost shares that Bitcoin remains a long time away from establishing a new…
Over the last day, Bitcoin prices have remained within the $70,000 – $72,000 region, recording…
Each escalation in the Iran conflict has been larger than the last, but each bitcoin…
The Bitcoin price has not particularly impressed over the past two weeks, but it appears…
Bitcoin’s extended pullback from its all-time high has left traders in uncertainty, and many investors…
Bitcoin recently pushed into a key liquidity pocket near the $73,000 level, briefly tapping overhead…