Bitcoin price is up over 8% and trading above the $67,500 resistance. BTC is eyeing a new all-time high and could even hit the $70,000 level.
Bitcoin price is moving higher above the $66,500 support zone.
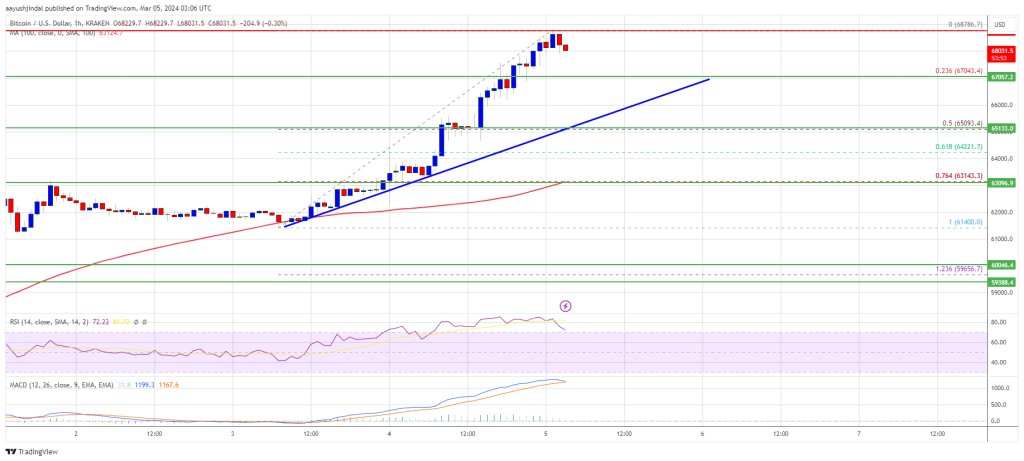
The price is trading above $67,500 and the 100 hourly Simple moving average.
There is a connecting bullish trend line forming with support at $66,000 on the hourly chart of the BTC/USD pair (data feed from Kraken).
The pair could accelerate higher toward the $69,200 resistance or even $70,000.
Bitcoin price remained well-bid above the $65,000 support zone. A new support base was formed, and the price started another rally above the $66,000 level. There was a steady increase toward the $67,500 level.
The price is up over 8% and it traded close to the last all-time high. A high is formed at $68,786 and the price is now consolidating gains above the 23.6% Fib retracement level of the upward move from the $61,400 swing low to the $68,786 high.
Bitcoin is now trading above $67,500 and the 100 hourly Simple moving average. There is also a connecting bullish trend line forming with support at $66,000 on the hourly chart of the BTC/USD pair.
Source: BTCUSD on TradingView.com
Immediate resistance is near the $68,800 level. The next key resistance could be $69,200, above which the price could rise toward the $70,000 resistance zone. If there is a clear move above the $70,000 resistance zone, the price could rise toward the $71,200 level. Any more gains might send the price toward the $75,000 level.
If Bitcoin fails to rise above the $68,800 resistance zone, it could start another downside correction. Immediate support on the downside is near the $67,000 level.
The first major support is $66,000 or the trend line. If there is a close below $66,000, the price could start a decent pullback toward the 50% Fib retracement level of the upward move from the $61,400 swing low to the $68,786 high or $65,000. Any more losses might send the price toward the $63,200 support zone.
Technical indicators:
Hourly MACD – The MACD is now gaining pace in the bullish zone.
Hourly RSI (Relative Strength Index) – The RSI for BTC/USD is now above the 50 level.
Major Support Levels – $67,000, followed by $66,000.
Major Resistance Levels – $68,800, $69,200, and $70,000.
[#item_full_content]NewsBTCRead MoreBitcoin’s recent price decline has led to many traders betting on further downside, with on-chain…
Bitcoin Magazine Bitcoin Bears Dominate: Failure to Break $71,800 Keeps Downside Risk Alive Bitcoin Price…
Bitcoin Magazine Metaplanet Reports $619 Million Loss as Bitcoin Holdings Take Hit Tokyo-based Bitcoin treasury…
Bitcoin Magazine Trump Family-Backed American Bitcoin Keeps Stacking Bitcoin, Holdings Pass 6,000 BTC Trump family-backed…
Bitcoin Magazine Payjoin Foundation Gains 501(c)(3) Status, Enabling Tax-Deductible Donations for Bitcoin Privacy Development The…
McGlone links bitcoin’s downturn to record U.S. market cap-to-GDP levels, low equity volatility and rising…