Bitcoin price rallied further above $62,000. BTC is now consolidating gains and might soon attempt another upward move toward the $64,000 resistance.
Bitcoin price is consolidating gains below the $60,000 resistance zone.
The price is trading above $60,500 and the 100 hourly Simple moving average.
There is a connecting bullish trend line forming with support at $60,950 on the hourly chart of the BTC/USD pair (data feed from Kraken).
The pair could extend its current rally toward the $64,000 resistance zone.
Bitcoin price remained strong above the $58,000 resistance zone. BTC formed a fresh support base and started another rally. It gained over 10% and broke many hurdles near $60,000 and $62,000.
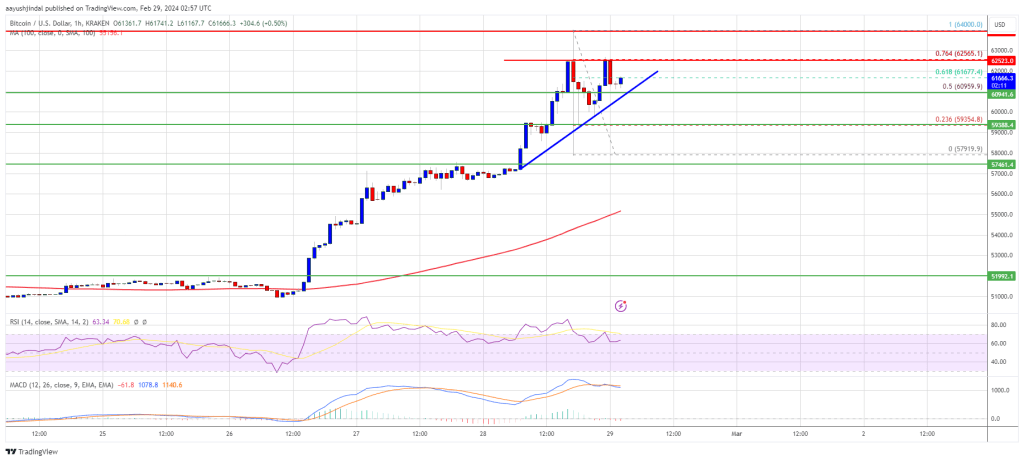
The price even surged toward the $64,000 level. A new multi-week high was formed near $64,000 before there was a sharp decline after the Coinbase outage. The price dived toward the $58,000 support zone. A low was formed near $57,919 and the price started a fresh rally.
It is back above the $60,000 resistance. There was a move above the 50% Fib retracement level of the downward move from the $64,000 swing high to the $57,919 low.
Bitcoin is now trading above $60,000 and the 100 hourly Simple moving average. There is also a connecting bullish trend line forming with support at $60,950 on the hourly chart of the BTC/USD pair. Immediate resistance is near the $62,500 level. It is near the 76.4% Fib retracement level of the downward move from the $64,000 swing high to the $57,919 low.
Source: BTCUSD on TradingView.com
The next key resistance could be $64,000, above which the price could rise toward the $65,000 resistance zone. If the bulls remain in action, the price could even surpass $65,000 and test $66,400. The main hurdle for them is visible near the $68,000 zone.
If Bitcoin fails to rise above the $62,500 resistance zone, it could start a downside correction. Immediate support on the downside is near the $60,800 level and the trend line.
The first major support is $60,000. If there is a close below $60,000, the price could start a decent pullback toward the $58,000 zone. Any more losses might send the price toward the $56,500 support zone.
Technical indicators:
Hourly MACD – The MACD is now gaining pace in the bullish zone.
Hourly RSI (Relative Strength Index) – The RSI for BTC/USD is now above the 50 level.
Major Support Levels – $60,800, followed by $60,000.
Major Resistance Levels – $62,500, $64,000, and $65,000.
[#item_full_content]NewsBTCRead MoreAccording to Matt Hougan, chief investment officer at Bitwise Asset Management, much of the crypto…
Options trading on BlackRock's spot bitcoin ETF, IBIT, surged to a record 2.33 million contracts…
Data shows the Bitcoin Fear & Greed Index has continued to decline recently, with its…
Bitcoin (BTC) has officially entered a new bear market after suffering a steep 50% decline…
On-chain data shows the Bitcoin Realized Loss has spiked to its highest level since November…
Bitcoin Magazine Strategy ($MSTR) Soars 25% as Bitcoin Rebounds Shares of Strategy ($MSTR) surged sharply…