Bitcoin price extended its increase toward the $28,500 resistance. BTC corrected gains and is currently holding a key support at $27,350.
Bitcoin climbed further higher above the $28,000 and $28,200 resistance levels.
The price is trading above $27,400 and the 100 hourly Simple moving average.
There is a major bullish trend line forming with support near $27,400 on the hourly chart of the BTC/USD pair (data feed from Kraken).
The pair could start another increase unless there is a move below the $26,650 support.
Bitcoin price started a decent increase above the $27,200 resistance zone. BTC climbed higher steadily above the $27,500 and $28,000 resistance levels.
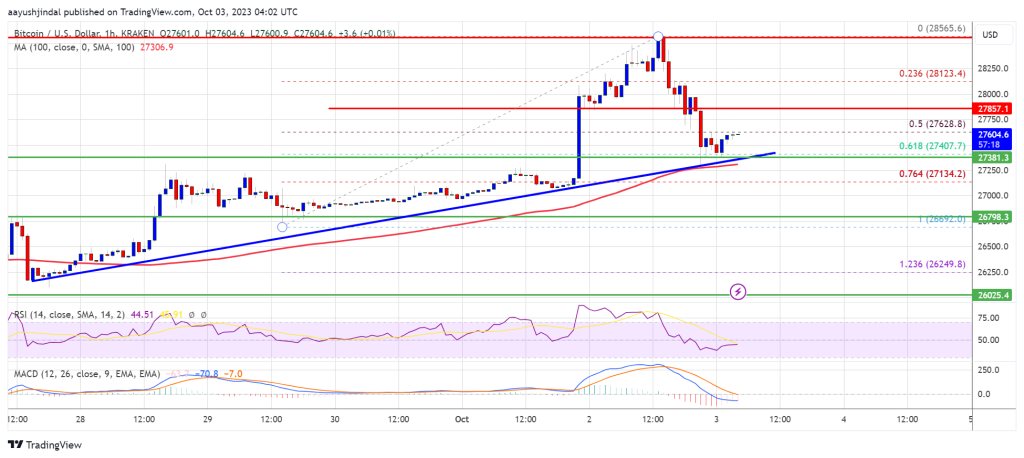
The price tested the $28,500 resistance. A new multi-week high was formed near $28,565 before it saw a downside correction. Finally, the price saw a downside correction below the $28,200 and $28,000 levels. It even moved below the 50% Fib retracement level of the upward move from the $26,690 swing low to the $28,565 high.
Bitcoin is still trading above $27,400 and the 100 hourly Simple moving average. Besides, there is a major bullish trend line forming with support near $27,400 on the hourly chart of the BTC/USD pair.
Immediate resistance on the upside is near the $27,850 level. The next key resistance could be near the $28,000 level. A close above the $28,000 resistance could start another increase.
Source: BTCUSD on TradingView.com
In the stated case, the price could climb toward the $28,500 resistance. Any more gains might call for a move toward the $29,200 level.
If Bitcoin fails to continue higher above the $28,000 resistance, there could be more downsides. Immediate support on the downside is near the $27,400 level and the trend line.
The next major support is near the $27,250 level or the 100 SMA. A downside break and close below the $27,250 level might send the price toward $26,800. The next support sits at $26,650. Any more losses might call for a test of $26,000.
Technical indicators:
Hourly MACD – The MACD is now losing pace in the bullish zone.
Hourly RSI (Relative Strength Index) – The RSI for BTC/USD is now below the 50 level.
Major Support Levels – $27,250, followed by $26,650.
Major Resistance Levels – $28,000, $28,500, and $29,200.
[#item_full_content]NewsBTCRead MoreOn-chain data shows the large Bitcoin holders have been participating in a notable amount of…
Google's quantum paper made headlines with that number. Here's what it means, what's actually at…
Ethereum could outpace Bitcoin by a wide margin over the next four years — at…
Bitcoin is often celebrated as a decentralized network, with mining power distributed globally to ensure…
Bitcoin (BTC) faces a stark downside risk that could send prices below the previous bear…
Crypto analyst Jordan has predicted that the Bitcoin price could rally to $80,000 in the…