Bitcoin price is holding gains above the $45,000 resistance. BTC seems to be setting up for more gains above the $46,000 level in the near term.
Bitcoin extended its increase and traded close to the $46,000 level.
The price is trading above $45,000 and the 100 hourly Simple moving average.
There is a key bullish flag forming with resistance near $45,300 on the hourly chart of the BTC/USD pair (data feed from Kraken).
The pair could start a fresh increase unless there is a correction wave below $44,800.
Bitcoin price started a fresh increase above the $44,000 and $44,500 resistance levels. BTC even broke the $45,000 level to move further into a bullish zone.
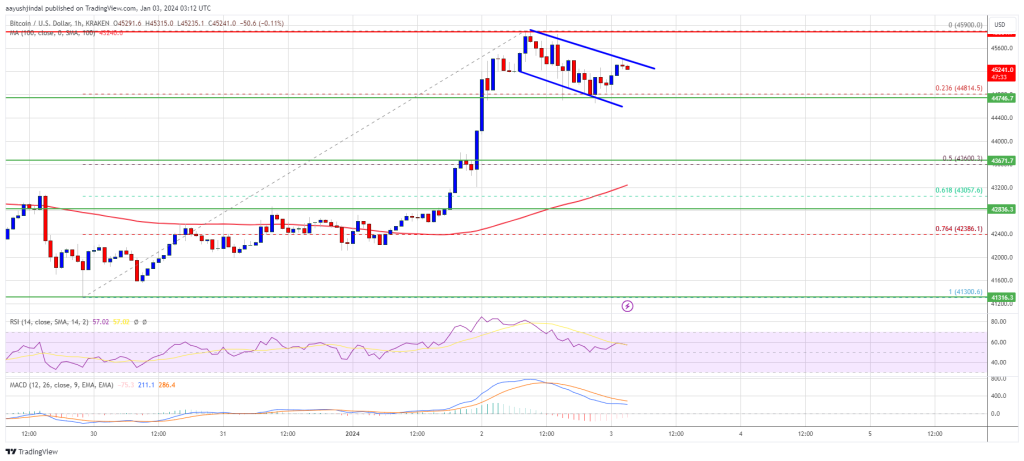
A new multi-week high was formed near $45,900 and the price is now consolidating gains. There was a minor downside correction from the $45,900 level. The price dipped below the $45,500 level. It even tested the 23.6% Fib retracement level of the upward move from the $41,300 swing low to the $45,900 high.
Bitcoin is now trading above $45,000 and the 100 hourly Simple moving average. On the upside, immediate resistance is near the $45,300 level. There is also a key bullish flag forming with resistance near $45,300 on the hourly chart of the BTC/USD pair.
Source: BTCUSD on TradingView.com
The first major resistance is $46,000. A close above the $46,000 level could send the price further higher. The next major resistance sits at $46,800. Any more gains above the $46,800 level could open the doors for a move toward the $48,000 level.
If Bitcoin fails to rise above the $45,300 resistance zone, it could start a downside correction. Immediate support on the downside is near the $44,800 level.
The next major support is near $44,000. If there is a move below $44,000, there is a risk of more losses. In the stated case, the price could drop toward the $43,600 support or the 50% Fib retracement level of the upward move from the $41,300 swing low to the $45,900 high in the near term.
Technical indicators:
Hourly MACD – The MACD is now losing pace in the bullish zone.
Hourly RSI (Relative Strength Index) – The RSI for BTC/USD is now above the 50 level.
Major Support Levels – $44,800, followed by $44,000.
Major Resistance Levels – $45,300, $46,000, and $46,800.
[#item_full_content]NewsBTCRead MoreYour day-ahead look for March 25, 2026Read MoreCoinDesk: Bitcoin, Ethereum, Crypto News and Price Data[#item_full_content]
As gold posts its worst run since 1920, bitcoin gains ground and outperforms, pushing the…
BTC rises with equities while surging open interest and fading volatility point to leveraged positioning…
Bitcoin traders are again staring at a chart structure that resembles the setup that preceded…
Bitcoin options worth billions of dollars will expire on Deribit this Friday at 8:00 UTC.Read…
Iran told the International Maritime Organization this week that non-hostile ships could pass through the…