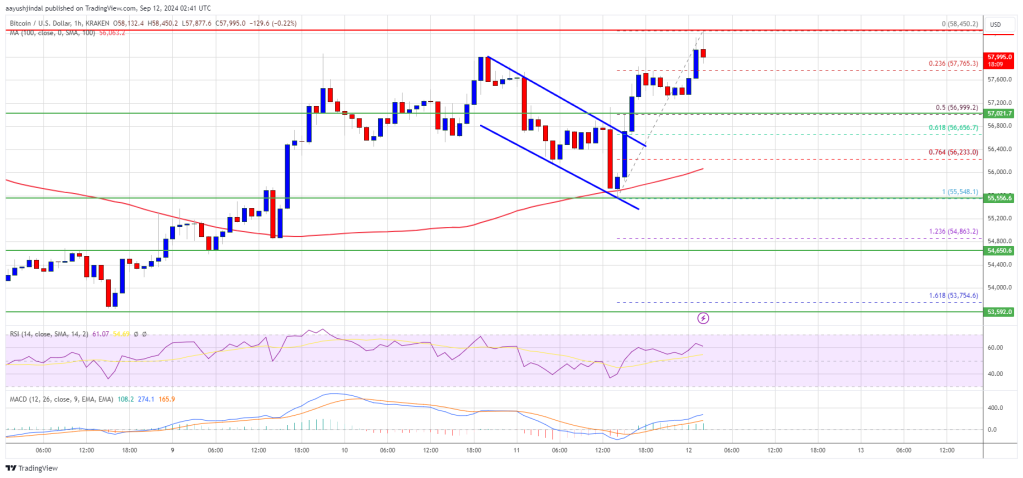
Bitcoin price started a decent increase above the $57,500 resistance. BTC is now showing positive signs and might aim for a move toward $60,000.
Bitcoin is attempting a fresh increase above the $57,000 support zone.
The price is trading above $57,200 and the 100 hourly Simple moving average.
There was a break above a short-term declining channel with resistance at $56,650 on the hourly chart of the BTC/USD pair (data feed from Kraken).
The pair could extend gains if it clears the $58,500 and $58,800 resistance levels in the near term.
Bitcoin price started a decent increase after it broke the $56,200 resistance zone. BTC was able to climb above the $57,000 resistance. There was also a break above a short-term declining channel with resistance at $56,650 on the hourly chart of the BTC/USD pair.
The pair even cleared the $58,000 resistance zone. It traded as high as $58,450 and is currently consolidating gains. It is positioned above the 23.6% Fib retracement level of the upward move from the $55,548 swing low to the $58,450 high.
Bitcoin is now trading above $57,200 and the 100 hourly Simple moving average. On the upside, the price could face resistance near the $58,500 level.
The first key resistance is near the $58,800 level. A clear move above the $58,800 resistance might start a steady increase in the coming sessions. The next key resistance could be $59,500. A close above the $59,500 resistance might spark more upsides. In the stated case, the price could rise and test the $60,000 resistance.
If Bitcoin fails to rise above the $58,500 resistance zone, it could start another decline. Immediate support on the downside is near the $57,500 level.
The first major support is $57,000 or the 50% Fib retracement level of the upward move from the $55,548 swing low to the $58,450 high. The next support is now near the $56,000 zone. Any more losses might send the price toward the $55,500 support in the near term.
Technical indicators:
Hourly MACD – The MACD is now gaining pace in the bullish zone.
Hourly RSI (Relative Strength Index) – The RSI for BTC/USD is now above the 50 level.
Major Support Levels – $57,000, followed by $56,000.
Major Resistance Levels – $58,500, and $58,800.
[#item_full_content]NewsBTCRead MoreCrypto markets are firm ahead of Wednesday’s Federal Reserve decision, with a 25 basis-point interest-rate…
The new preferred stock offering, SATA, strengthens Strive’s capital options as it expands its bitcoin…
Over the last few days, the Bitcoin price has fluctuated, but the most prominent moves…
Standard Chartered has sharply reduced its famously bullish Bitcoin roadmap, cutting its 2026 price target…
Ark Invest’s CEO and CIO, Cathie Wood, joined Fox Business’s “Morning With Maria” to discuss…
Market depth in smaller tokens remained thin, echoing the uneven liquidity that has characterized December…