Bitcoin price started a fresh increase above the $82,500 zone. BTC is now consolidating gains and might attempt to clear the $85,850 resistance.
Bitcoin started a fresh increase above the $83,200 zone.
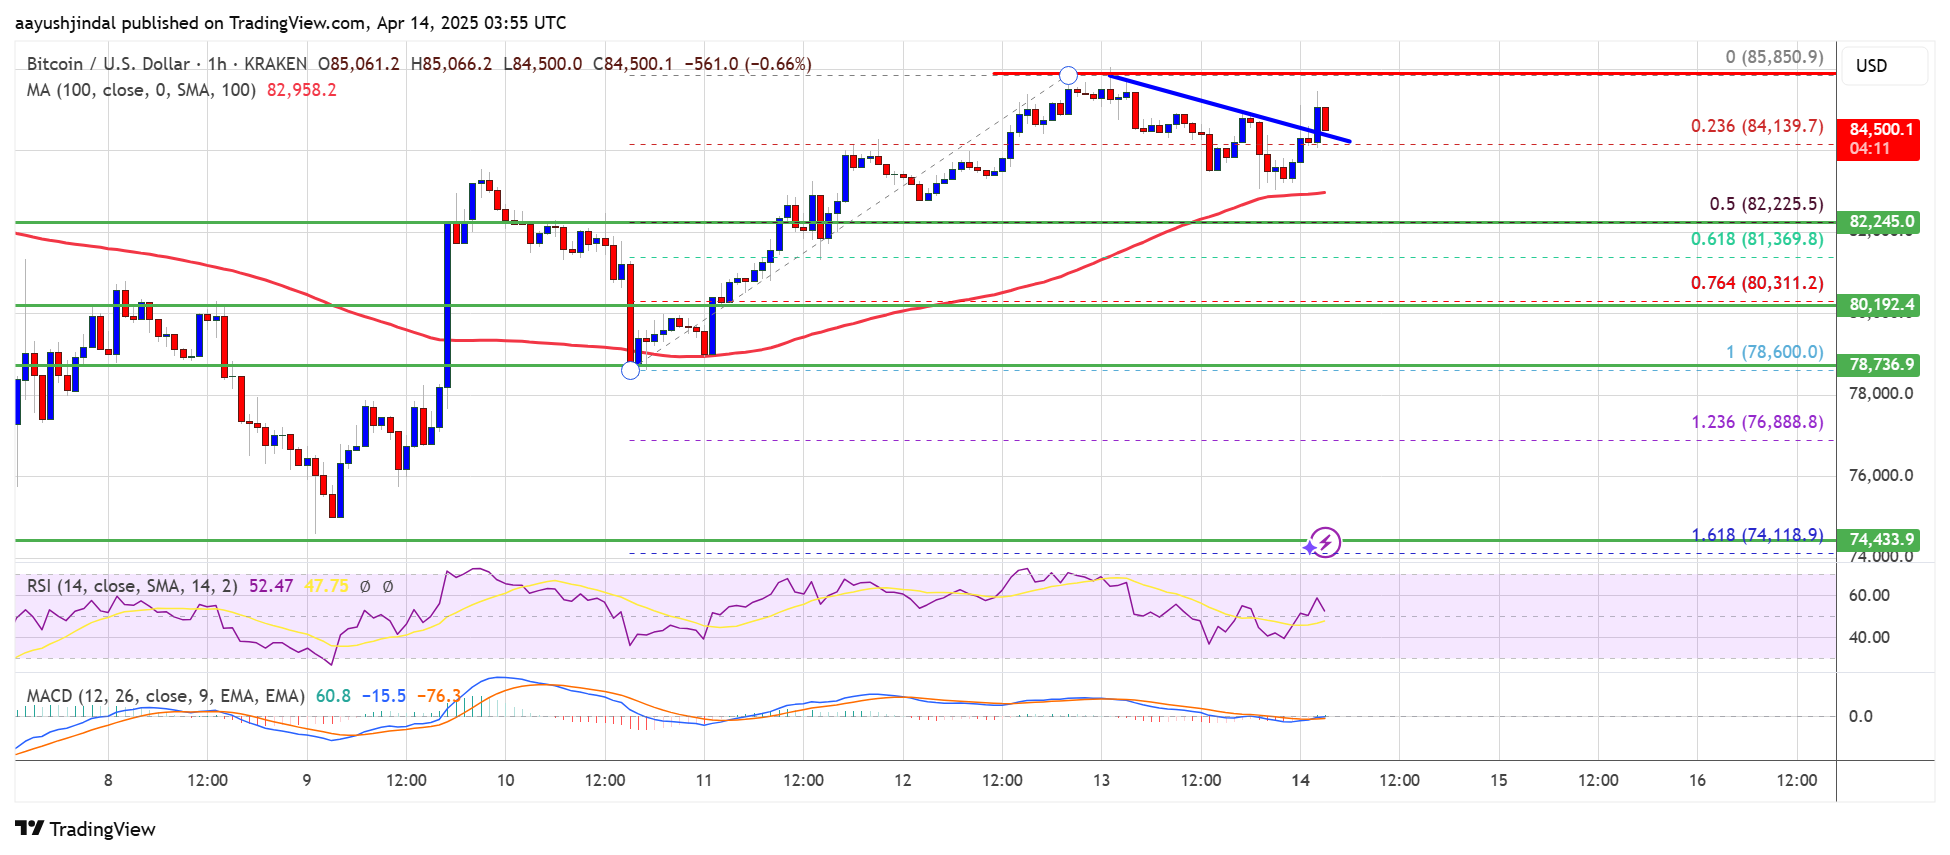
The price is trading above $82,500 and the 100 hourly Simple moving average.
There was a break above a connecting bearish trend line with resistance at $84,500 on the hourly chart of the BTC/USD pair (data feed from Kraken).
The pair could start another increase if it clears the $85,500 zone.
Bitcoin price started a fresh increase above the $81,500 zone. BTC formed a base and gained pace for a move above the $82,500 and $83,200 resistance levels.
The bulls pumped the price above the $84,500 resistance. A high was formed at $85,850 and the price recently started a downside correction. There was a move below the $84,500 support. The price dipped below the 23.6% Fib retracement level of the upward move from the $78,600 swing low to the $85,850 high.
However, the price remained stable above $82,200. Bitcoin price is now trading above $82,500 and the 100 hourly Simple moving average. There was a break above a connecting bearish trend line with resistance at $84,500 on the hourly chart of the BTC/USD pair.
On the upside, immediate resistance is near the $85,500 level. The first key resistance is near the $85,850 level. The next key resistance could be $86,500. A close above the $86,500 resistance might send the price further higher. In the stated case, the price could rise and test the $88,000 resistance level. Any more gains might send the price toward the $88,800 level.
If Bitcoin fails to rise above the $85,500 resistance zone, it could continue to move down. Immediate support on the downside is near the $84,200 level. The first major support is near the $82,200 level and the 50% Fib retracement level of the upward move from the $78,600 swing low to the $85,850 high.
The next support is now near the $81,200 zone. Any more losses might send the price toward the $80,500 support in the near term. The main support sits at $80,000.
Technical indicators:
Hourly MACD – The MACD is now gaining pace in the bullish zone.
Hourly RSI (Relative Strength Index) – The RSI for BTC/USD is now above the 50 level.
Major Support Levels – $84,500, followed by $82,200.
Major Resistance Levels – $85,500 and $85,800.
[#item_full_content]NewsBTCRead MoreTokyo-listed Metaplanet is expanding beyond holding BTC into funding, incubating, and granting to companies building…
The bridging protocol's team wants to exchange ACX tokens for equity in a new U.S.…
Brent crude surged 10% after attacks on two oil tankers in Iraqi waters, with the…
Bitcoin price failed to extend its recovery wave above the $70,500 zone. BTC is now…
Bitcoin Magazine Coinbase CPO Rejects Claims of Opposing Bitcoin Tax Relief as Jack Dorsey Demands…
The security architecture surrounding Bitcoin continues to evolve as new infrastructure emerges to support self-custody…