Bitcoin price extended its rally above the $48,800 resistance. BTC tested $50,000 and is currently showing signs of a downside correction.
Bitcoin price climbed higher above the $48,500 and $48,800 resistance levels.
The price is trading above $48,800 and the 100 hourly Simple moving average.
There is a short-term rising channel forming with support at $49,750 on the hourly chart of the BTC/USD pair (data feed from Kraken).
The pair could start a downside correction below the $49,750 and $49,500 levels.
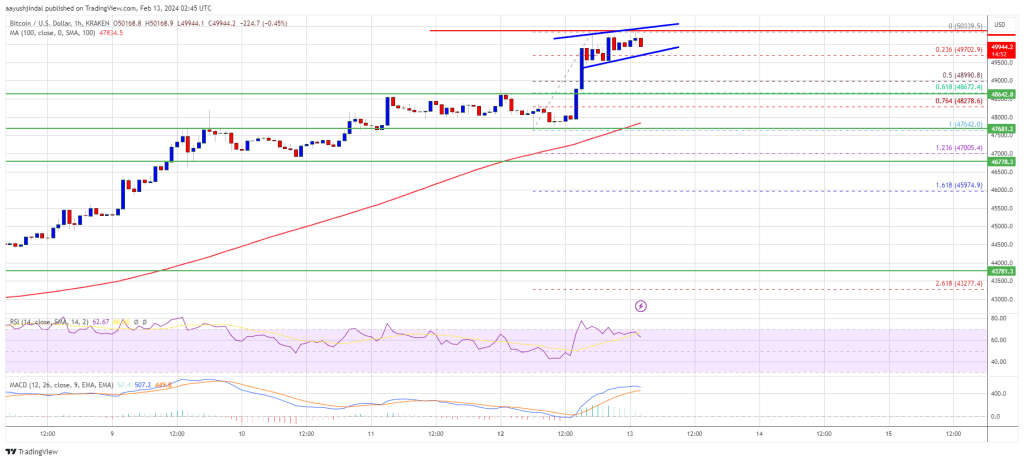
Bitcoin price remained in a positive zone above the $48,000 resistance zone. BTC extended its rally and climbed above the $48,800 resistance zone. Finally, the price jumped above the $50,000 level.
A new multi-week high was formed near $50,339 and the price is now consolidating gains. There was a minor decline below the $50,000 level. The price is still above the 23.6% Fib retracement level of the recent rally from the $47,642 swing low to the $50,339 high.
Bitcoin price is now trading above $48,800 and the 100 hourly Simple moving average. There is also a short-term rising channel forming with support at $49,750 on the hourly chart of the BTC/USD pair.
Source: BTCUSD on TradingView.com
Immediate resistance is near the $50,250 level. The next key resistance could be $50,400, above which the price could start another decent increase. The next stop for the bulls may perhaps be $51,200. A clear move above the $51,200 resistance could send the price toward the $52,000 resistance. The next resistance could be near the $53,000 level.
If Bitcoin fails to rise above the $50,250 resistance zone, it could start a downside correction. Immediate support on the downside is near the $49,750 level or the channel trend line.
The first major support is $49,000 and the 50% Fib retracement level of the recent rally from the $47,642 swing low to the $50,339 high. If there is a close below $49,000, the price could gain bearish momentum. In the stated case, the price could dive toward the $47,650 support.
Technical indicators:
Hourly MACD – The MACD is now losing pace in the bullish zone.
Hourly RSI (Relative Strength Index) – The RSI for BTC/USD is now above the 50 level.
Major Support Levels – $49,750, followed by $49,000.
Major Resistance Levels – $50,250, $50,400, and $51,200.
[#item_full_content]NewsBTCRead MoreThe Bitcoin price displayed a staggering show of bearish pressure over the week. As the…
Amid a recent Bitcoin price rebound, Coinbase Premium data shows that American investors are renewing…
Bitcoin is hovering around the $65,000 level as persistent selling pressure continues to weigh on…
A new theory circulating in the crypto market is challenging how investors interpret Bitcoin’s recent…
Bitcoin has experienced one of its sharpest corrections in recent years, slipping below the $65,000…
Bitcoin’s roughly 50% drawdown has less to do with cycle déjà vu than a deeper…