Bitcoin price struggled to surpass $126,200 and corrected gains. BTC is now consolidating near $122,000 and might aim for a recovery wave.
Bitcoin started a downside correction below the $125,000 level.
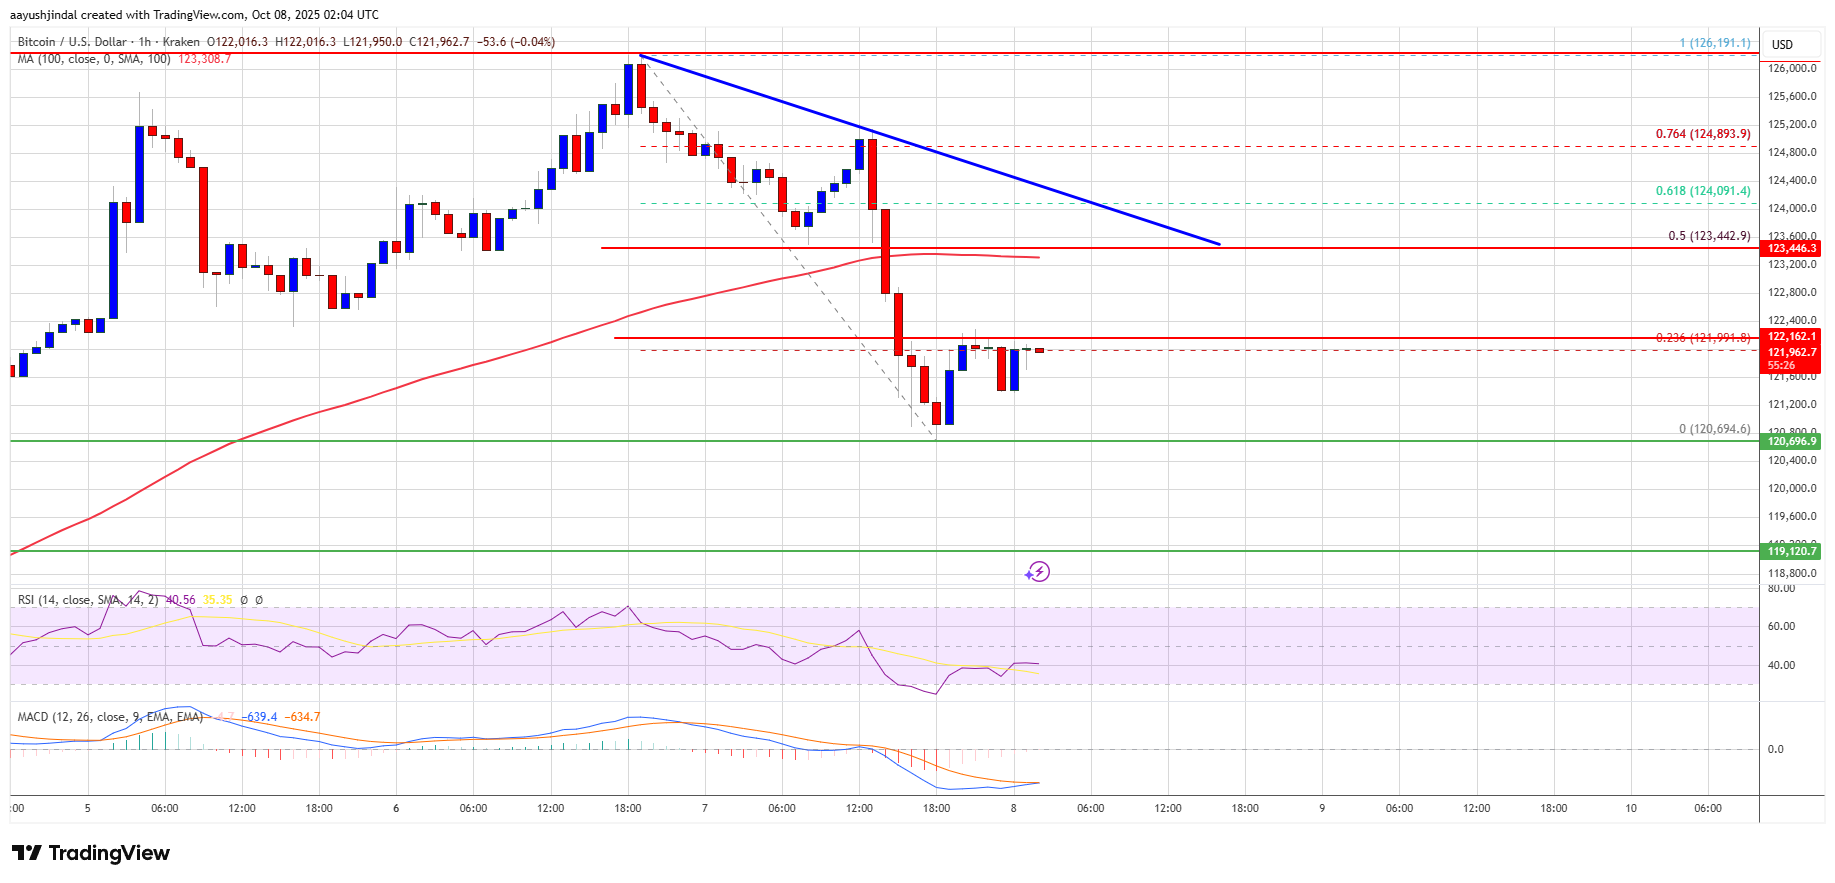
The price is trading below $124,000 and the 100 hourly Simple moving average.
There is a key bearish trend line forming with resistance at $123,500 on the hourly chart of the BTC/USD pair (data feed from Kraken).
The pair might continue to move down if it trades below the $120,500 zone.
Bitcoin price extended gains above the $124,000 zone. BTC climbed above the $125,000 and $125,500 resistance levels before the bears appeared.
A new high was formed at $126,198 before there was a downside correction. The price dipped below the $124,000 support zone. There was a sharp move and the price tested the $120,500 region. The price is now consolidating near the 23.6% Fib retracement level of the recent decline from the $126,191 swing high to the $120,694 low.
Bitcoin is now trading below $124,000 and the 100 hourly Simple moving average. Besides, there is a key bearish trend line forming with resistance at $123,500 on the hourly chart of the BTC/USD pair.
Immediate resistance on the upside is near the $122,250 level. The first key resistance is near the $123,500 level and the trend line. It is close to the 50% Fib level of the recent decline from the $126,191 swing high to the $120,694 low.
The next resistance could be $124,200. A close above the $124,200 resistance might send the price further higher. In the stated case, the price could rise and test the $125,500 resistance. Any more gains might send the price toward the $126,000 level. The next barrier for the bulls could be $126,200.
If Bitcoin fails to rise above the $123,500 resistance zone, it could start a fresh decline. Immediate support is near the $121,200 level. The first major support is near the $120,500 level.
The next support is now near the $118,500 zone. Any more losses might send the price toward the $116,200 support in the near term. The main support sits at $115,500, below which BTC might struggle to recover in the short term.
Technical indicators:
Hourly MACD – The MACD is now losing pace in the bullish zone.
Hourly RSI (Relative Strength Index) – The RSI for BTC/USD is now below the 50 level.
Major Support Levels – $121,200, followed by $120,500.
Major Resistance Levels – $122,250 and $123,500.
[#item_full_content]NewsBTCRead MoreBitcoin briefly surged to a six-week high above $75,000 before quickly retreating, underscoring the fragility…
Bitcoin's move, led by unwinding of shorts, has lifted the broader crypto market, with the…
A short message from Michael Saylor has once again stirred speculation that Strategy could be…
Bitcoin price started a strong increase above the $75,000 zone. BTC is now consolidating and…
A potential US military strike on Iran’s main oil export terminal helped push Bitcoin to…
Bitcoin Magazine Bitcoin Price Surges Above $75,000 as Bullish Momentum Builds The bitcoin price climbed…