Bitcoin price remained stable above the $58,500 support zone. BTC is struggling and could only start a steady increase if it clears $61,500.
Bitcoin is struggling to rise above the $60,200 and $61,500 resistance levels.
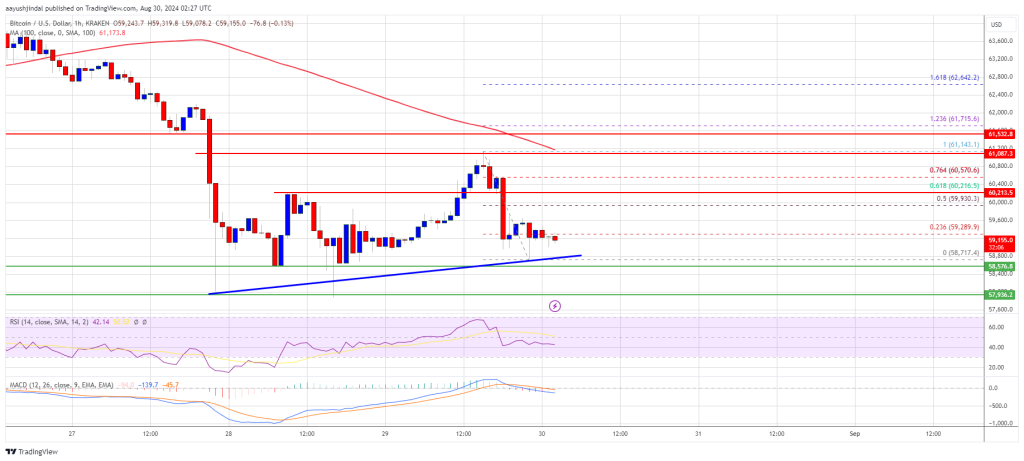
The price is trading below $61,000 and the 100 hourly Simple moving average.
There is a connecting bullish trend line forming with support at $58,800 on the hourly chart of the BTC/USD pair (data feed from Kraken).
The pair might extend losses if it fails to stay above the $58,500 support.
Bitcoin price remained stable above the $58,000 and $58,500 support levels. A base was formed, and the price attempted a recovery wave above the $59,500 level. However, the bears were active near the $61,200 level.
There was a fresh decline, and the price retested the $58,800 support. A low was formed at $58,717 and the price is now consolidating losses. It is stuck near the 23.6% Fib retracement level of the recent decline from the $61,143 swing high to the $58,717 low.
Bitcoin is now trading below $61,000 and the 100 hourly Simple moving average. There is also a connecting bullish trend line forming with support at $58,800 on the hourly chart of the BTC/USD pair.
On the upside, the price could face resistance near the $59,650 level. The first key resistance is near the $60,200 level. It is near the 61.8% Fib retracement level of the recent decline from the $61,143 swing high to the $58,717 low.
A clear move above the $60,200 resistance might send the price further higher in the coming sessions. The next key resistance could be $61,200. A close above the $61,200 resistance might spark more upsides. In the stated case, the price could rise and test the $62,500 resistance.
If Bitcoin fails to rise above the $60,200 resistance zone, it could start another decline. Immediate support on the downside is near the $58,800 level and the trend line.
The first major support is $58,500. The next support is now near the $58,000 zone. Any more losses might send the price toward the $56,500 support in the near term.
Technical indicators:
Hourly MACD – The MACD is now losing pace in the bearish zone.
Hourly RSI (Relative Strength Index) – The RSI for BTC/USD is now below the 50 level.
Major Support Levels – $58,800, followed by $58,000.
Major Resistance Levels – $60,200, and $61,200.
[#item_full_content]NewsBTCRead MoreBitcoin Magazine Metaplanet Adds 2,823 Bitcoin, Reaches 43,000 BTC and Becomes World’s Third-Largest Corporate Treasury…
Bitcoin and major cryptocurrencies rebounded on dovish Federal Reserve signals, with speculative tokens like Memecore’s…
Your day-ahead look for July 2, 2026Read MoreCoinDesk: Bitcoin, Ethereum, Crypto News and Price Data[#item_full_content]
Bitcoin rose more than 4% to trade above $61,000, its strongest level in over a…
The Japanese firm, now the world's third largest publicly traded bitcoin holder, reported stronger Bitcoin…
Post ContentRead MoreCoinDesk: Bitcoin, Ethereum, Crypto News and Price Data[#item_full_content]