Bitcoin price remained stable above the $58,500 support zone. BTC is struggling and could only start a steady increase if it clears $61,500.
Bitcoin is struggling to rise above the $60,200 and $61,500 resistance levels.
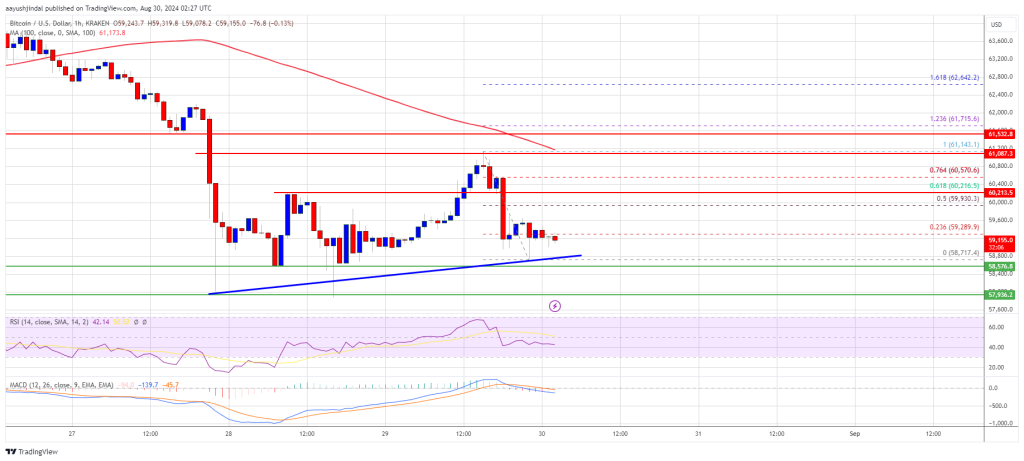
The price is trading below $61,000 and the 100 hourly Simple moving average.
There is a connecting bullish trend line forming with support at $58,800 on the hourly chart of the BTC/USD pair (data feed from Kraken).
The pair might extend losses if it fails to stay above the $58,500 support.
Bitcoin price remained stable above the $58,000 and $58,500 support levels. A base was formed, and the price attempted a recovery wave above the $59,500 level. However, the bears were active near the $61,200 level.
There was a fresh decline, and the price retested the $58,800 support. A low was formed at $58,717 and the price is now consolidating losses. It is stuck near the 23.6% Fib retracement level of the recent decline from the $61,143 swing high to the $58,717 low.
Bitcoin is now trading below $61,000 and the 100 hourly Simple moving average. There is also a connecting bullish trend line forming with support at $58,800 on the hourly chart of the BTC/USD pair.
On the upside, the price could face resistance near the $59,650 level. The first key resistance is near the $60,200 level. It is near the 61.8% Fib retracement level of the recent decline from the $61,143 swing high to the $58,717 low.
A clear move above the $60,200 resistance might send the price further higher in the coming sessions. The next key resistance could be $61,200. A close above the $61,200 resistance might spark more upsides. In the stated case, the price could rise and test the $62,500 resistance.
If Bitcoin fails to rise above the $60,200 resistance zone, it could start another decline. Immediate support on the downside is near the $58,800 level and the trend line.
The first major support is $58,500. The next support is now near the $58,000 zone. Any more losses might send the price toward the $56,500 support in the near term.
Technical indicators:
Hourly MACD – The MACD is now losing pace in the bearish zone.
Hourly RSI (Relative Strength Index) – The RSI for BTC/USD is now below the 50 level.
Major Support Levels – $58,800, followed by $58,000.
Major Resistance Levels – $60,200, and $61,200.
[#item_full_content]NewsBTCRead MoreBitcoin printed one of the largest ever daily candles to the downside on Thursday, sliding…
Traders on X are pointing to everything from a Hong Kong fund blowup to yen…
Bitcoin is struggling to hold the $70,000 level as persistent selling pressure weighs on market…
The latest downturn in Bitcoin (BTC) has begun to weigh heavily on publicly listed companies…
Record volume, redemptions and pronounced tilt toward put options points to institutional capitulation.Read MoreCoinDesk: Bitcoin,…
The largest transfers went to credit and trading firm Two Prime, which received more than…