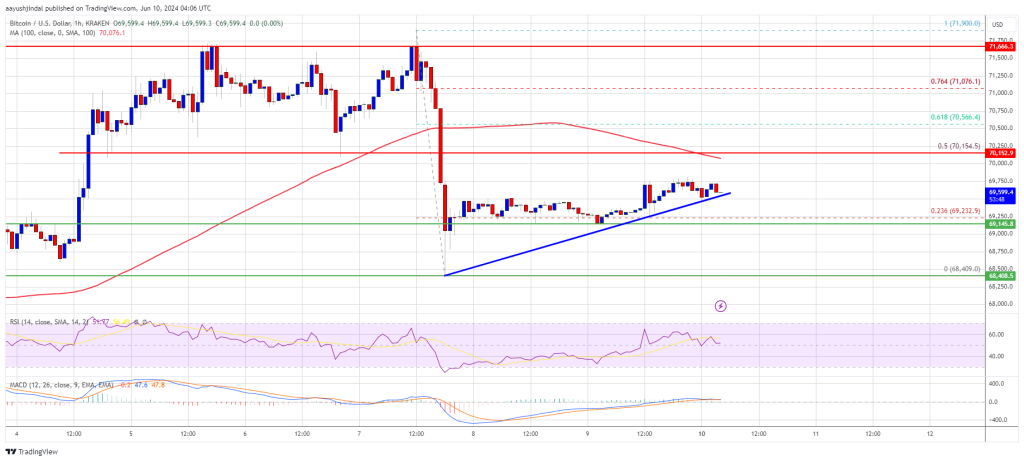
Bitcoin price stayed above the $68,500 support zone. BTC is now consolidating and might aim for a fresh increase above the $70,150 resistance.
Bitcoin found support near $68,500 and started a decent recovery wave.
The price is trading below $70,000 and the 100 hourly Simple moving average.
There is a key bullish trend line forming with support at $69,500 on the hourly chart of the BTC/USD pair (data feed from Kraken).
The pair could decline again if there is no move above the $70,150 resistance.
Bitcoin price extended its decline below the $70,000 support zone. BTC even declined below the $69,500 level before the bulls appeared near $68,500. A low was formed at $68,409 and the price is now attempting a recovery wave.
There was a move above the $69,250 resistance zone. The price climbed above the 23.6% Fib retracement level of the downward move from the $71,900 swing high to the $68,409 low.
Bitcoin is now trading below $70,000 and the 100 hourly Simple moving average. However, there is a key bullish trend line forming with support at $69,500 on the hourly chart of the BTC/USD pair. On the upside, the price is facing resistance near the $70,000 level.
The first major resistance could be $70,150 and the 50% Fib retracement level of the downward move from the $71,900 swing high to the $68,409 low. The next key resistance could be $70,550. A clear move above the $70,550 resistance might send the price higher. In the stated case, the price could rise and test the $71,200 resistance. Any more gains might send BTC toward the $72,000 resistance.
If Bitcoin fails to climb above the $70,150 resistance zone, it could start another decline. Immediate support on the downside is near the $69,500 level and the trend line.
The first major support is $69,150. The next support is now forming near $68,500. Any more losses might send the price toward the $67,500 support zone in the near term.
Technical indicators:
Hourly MACD – The MACD is now losing pace in the bearish zone.
Hourly RSI (Relative Strength Index) – The RSI for BTC/USD is now above the 50 level.
Major Support Levels – $69,500, followed by $68,500.
Major Resistance Levels – $70,150, and $70,500.
[#item_full_content]NewsBTCRead MoreBitcoin is sitting just below $70,000, but the sharper signal may be in the derivatives…
As Bitcoin (BTC) attempts to reclaim a key resistance area, an analyst has suggested that…
Spot bitcoin ETFs pulled in $471 million on April 6, the 6th-largest inflow of 2026,…
Bitcoin is still far from triggering the three signals that have historically appeared at the…
The AI company's partnership with Google and Broadcom for next-generation TPU capacity starting in 2027…
Glassnode data shows soft participation, while a negative gamma setup below $68,000 leaves BTC exposed…