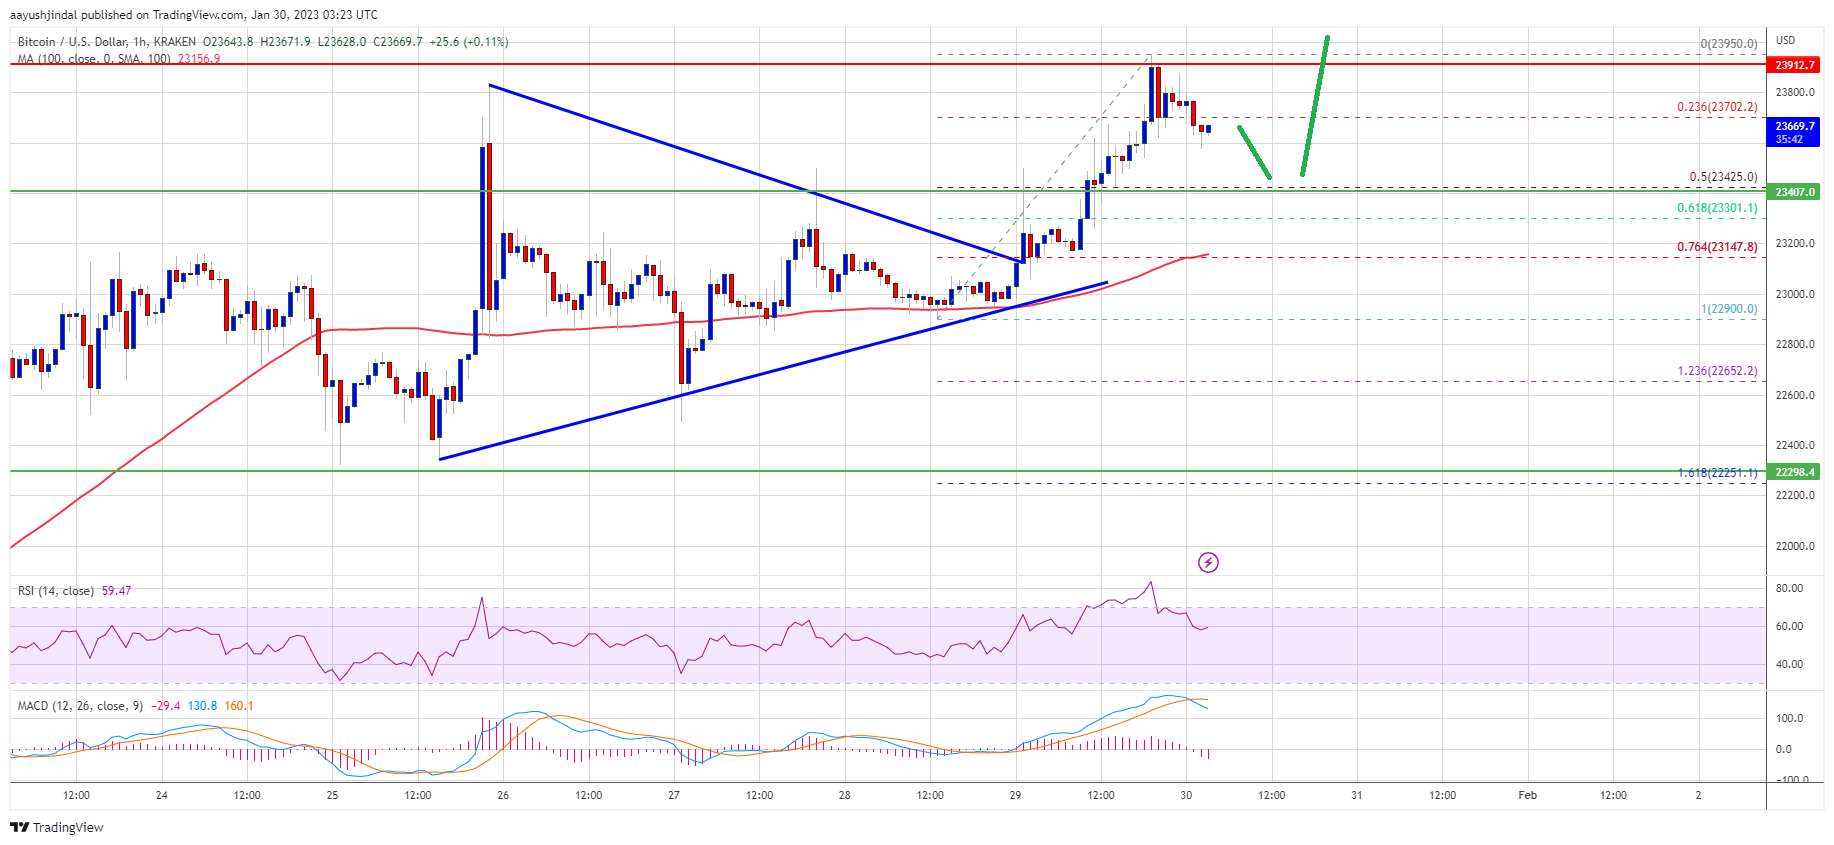
Bitcoin price started another increase above the $23,000 resistance. BTC is rising and the bulls might aim a test of the $25,000 resistance zone.
Bitcoin is gaining pace above the $23,500 resistance zone.
The price is trading above $23,000 and the 100 hourly simple moving average.
There was a break above a key contracting triangle with resistance near $23,145 on the hourly chart of the BTC/USD pair (data feed from Kraken).
The pair could rise further towards $25,000 if it stays above the $23,450 support zone.
Bitcoin price remained well bid above the $22,500 support zone. BTC formed a base and started a fresh increase above the $23,000 resistance zone.
The bulls were able to pump the price above the $23,200 resistance and the 100 hourly simple moving average. The price even cleared the $23,500 resistance zone and traded to a new yearly high at $23,950. During the increase, there was a break above a key contracting triangle with resistance near $23,145 on the hourly chart of the BTC/USD pair.
It is now consolidating below the 23.6% Fib retracement level of the recent increase from the $22,900 swing low to $23,950 high. Bitcoin price is also trading above $23,000 and the 100 hourly simple moving average.
Source: BTCUSD on TradingView.com
An immediate resistance is near the $23,800 level. The next major resistance is near the $24,200 zone, above which the price might start a strong increase. In the stated case, the price may perhaps rise towards the $25,000 level. The next resistance could be near the $25,500 level. Any more gains might send btc price towards the $26,000 level.
If bitcoin price fails to clear the $23,800 resistance, it could start a downside correction. An immediate support on the downside is near the $23,650 zone.
The next major support is near the $23,450 zone or the 50% Fib retracement level of the recent increase from the $22,900 swing low to $23,950 high. A downside break below the $23,450 level might send the price towards the $23,150 level. Any more losses might send the price to $22,650 in the near term.
Technical indicators:
Hourly MACD – The MACD is now losing pace in the bullish zone.
Hourly RSI (Relative Strength Index) – The RSI for BTC/USD is now above the 50 level.
Major Support Levels – $23,450, followed by $23,200.
Major Resistance Levels – $23,800, $23,950 and $24,200.
Tags: bitcoinbitcoin pricebtcusdBTCUSDTxbtusd
NewsBTCRead More
Long-term holding wallets have shifted to net accumulation from net distribution, according to Glassnode.Read MoreCoinDesk:…
Bitcoin climbed back above $60,000 for the first time in over a week after Fed…
Bitcoin Magazine Bitcoin Price Reclaims $60,000 As Strategy (MSTR) and Strive (ASST) Jump More Than…
Bitcoin Magazine AI’s Bitcoin Moment: Why the Open-Source Fight Looks Like Crypto Back in 2014…
Crypto exchange balances saw a notable withdrawal wave heading into July 1, with USDC and…
Bitcoin Magazine Moody’s Flags Quantum Threat to Bitcoin and Digital Assets After Trump Orders A…