Bitcoin price is moving higher above the $71,200 resistance. BTC is showing positive signs and might soon extend gains above $72,500.
Bitcoin climbed higher above $69,500 and $70,000 resistance levels.
The price is trading above $70,000 and the 100 hourly Simple moving average.
There is a key bullish trend line forming with support near $70,750 on the hourly chart of the BTC/USD pair (data feed from Kraken).
The pair could accelerate higher if it clears the $72,500 resistance zone.
Bitcoin price started a decent increase above the $68,500 resistance zone. BTC cleared the $69,500 and $70,000 resistance levels to move into a positive zone.
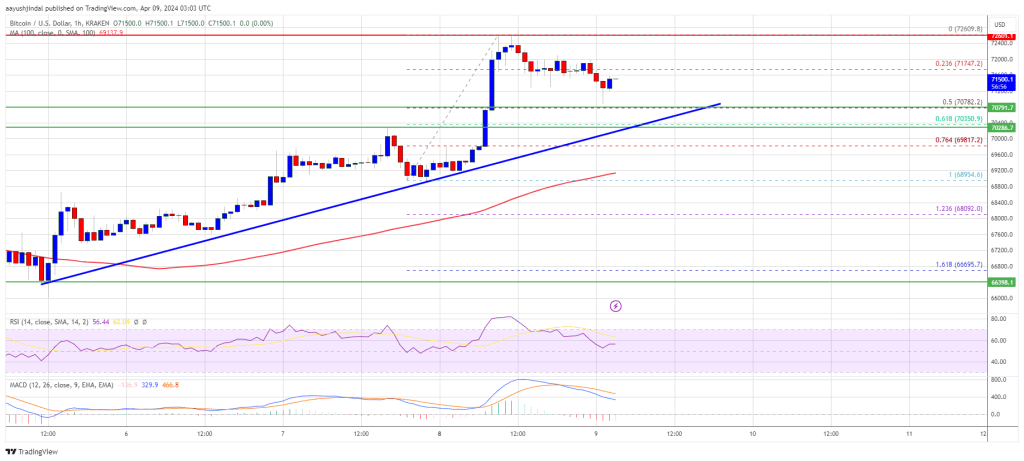
The price even cleared the $71,200 resistance zone. A high was formed near the $72,609 level and the price is now correcting gains. There was a move below the $72,000 level. The price corrected lower below the 23.6% Fib retracement level of the upward wave from the $68,954 swing low to the $72,609 high.
Bitcoin is now trading above $70,000 and the 100 hourly Simple moving average. There is also a key bullish trend line forming with support near $70,750 on the hourly chart of the BTC/USD pair. The trend line is close to the 50% Fib retracement level of the upward wave from the $68,954 swing low to the $72,609 high.
Immediate resistance is near the $72,000 level. The first major resistance could be $72,500. The next resistance now sits at $72,800. If there is a clear move above the $72,800 resistance zone, the price could start a fresh increase.
Source: BTCUSD on TradingView.com
In the stated case, the price could rise toward $73,500. The next major resistance is near the $74,000 zone. Any more gains might send Bitcoin toward the $75,000 resistance zone in the near term.
If Bitcoin fails to rise above the $72,000 resistance zone, it could continue to move down. Immediate support on the downside is near the $70,7500 level or the trend line.
The first major support is $70,350. The next support sits at $70,000. If there is a close below $70,000, the price could start a drop toward the $68,500 level. Any more losses might send the price toward the $67,500 support zone in the near term.
Technical indicators:
Hourly MACD – The MACD is now losing pace in the bullish zone.
Hourly RSI (Relative Strength Index) – The RSI for BTC/USD is now near the 50 level.
Major Support Levels – $70,750, followed by $70,000.
Major Resistance Levels – $72,000, $72,500, and $73,500.
[#item_full_content]NewsBTCRead MoreThe Royal Government of Bhutan transferred 519.707 BTC on Wednesday, the latest in a series…
Bitcoin price started a recovery wave above $70,000. BTC is now consolidating above $70,200 and…
Bitcoin remains locked in a tight range, leaving traders uncertain about its next major move.…
Bitcoin’s miner supply picture remains tighter than in past cycles, but not tight enough to…
A crypto analyst has issued a bold long-term forecast for Bitcoin, predicting that a capital…
Bitcoin is holding above $70,000. The number looks resilient. The geography behind it tells a…