Bitcoin price started another increase above the $70,000 resistance. BTC cleared $72,000 and now the bulls seem to be aiming for a move toward $75,000.
Bitcoin price started another increase above the $70,000 and $71,000 levels.
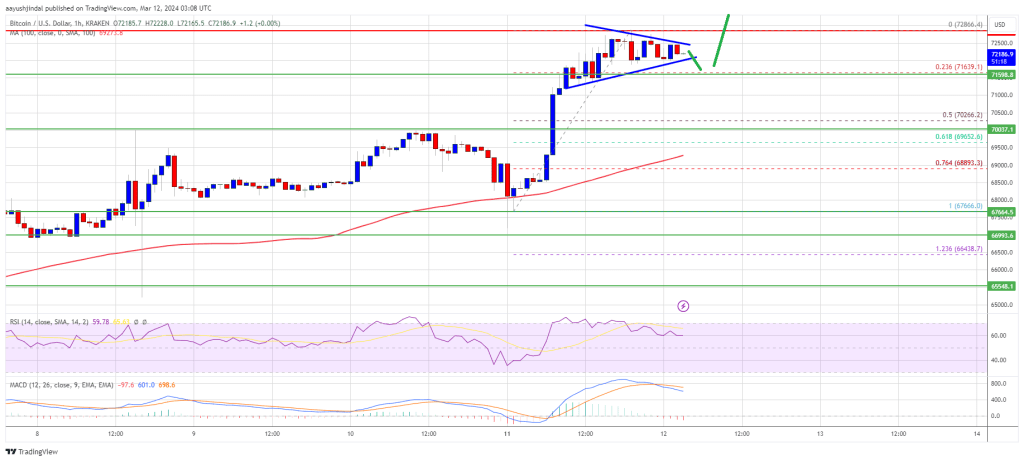
The price is trading above $71,500 and the 100 hourly Simple moving average.
There is a short-term contracting triangle forming with resistance at $72,500 on the hourly chart of the BTC/USD pair (data feed from Kraken).
The pair could continue to move up if it clears the $72,500 and $72,850 resistance levels.
Bitcoin price remained stable above the $68,000 level. BTC formed a support base and recently started a fresh increase above the $70,000 resistance. The bulls pumped the price above the $72,000 level.
The price traded to a new all-time high at $72,866. It is now consolidating gains near the 23.6% Fib retracement level of the upward move from the $67,666 swing low to the $72,866 high. There is also a short-term contracting triangle forming with resistance at $72,500 on the hourly chart of the BTC/USD pair.
Bitcoin is now trading above $72,000 and the 100 hourly Simple moving average. Immediate resistance is near the $72,500 level and the triangle zone. The next key resistance could be $72,850, above which the price could rise toward the $73,500 resistance zone.
Source: BTCUSD on TradingView.com
If there is a clear move above the $73,500 resistance zone, the price could even attempt a move above the $74,000 resistance zone. Any more gains might send the price toward the $75,000 level.
If Bitcoin fails to rise above the $72,500 resistance zone, it could start a downside correction. Immediate support on the downside is near the $72,000 level.
The first major support is $70,000 or the 50% Fib retracement level of the upward move from the $67,666 swing low to the $72,866 high. If there is a close below $70,000, the price could start a decent pullback toward the $68,500 level. Any more losses might send the price toward the $66,600 support zone.
Technical indicators:
Hourly MACD – The MACD is now losing pace in the bullish zone.
Hourly RSI (Relative Strength Index) – The RSI for BTC/USD is now above the 50 level.
Major Support Levels – $72,000, followed by $70,000.
Major Resistance Levels – $72,500, $72,850, and $73,500.
[#item_full_content]NewsBTCRead MoreThe founder of CryptoQuant has explained that Bitcoin is not “pumpable” right now based on…
Bitcoin price started a recovery wave above $68,500. BTC is now struggling to clear $72,000…
Bitcoin’s latest drawdown from its all-time high is being compared to 2022 across crypto Twitter…
Scaramucci noted that SkyBridge has been purchasing bitcoin at various price points, including around $84,000,…
Bitcoin’s mining landscape is showing clear signs of stress as network difficulty records its largest…
The Bitcoin and Ethereum prices have rebounded from last week’s lows, providing optimism that the…