Bitcoin price cleared the key $35,000 resistance. BTC is showing positive signs and might rally toward the $36,200 and $37,000 levels in the near term.
Bitcoin is gaining pace above the $35,000 resistance.
The price is trading above $35,000 and the 100 hourly Simple moving average.
There was a break above a rising channel with resistance at $34,850 on the hourly chart of the BTC/USD pair (data feed from Kraken).
The pair is showing positive signs and might rise toward the $37,000 resistance in the near term.
Bitcoin price remained well-bid above the $34,000 support zone. BTC formed a base, completed a consolidation phase, and recently started a decent increase above the $34,750 resistance.
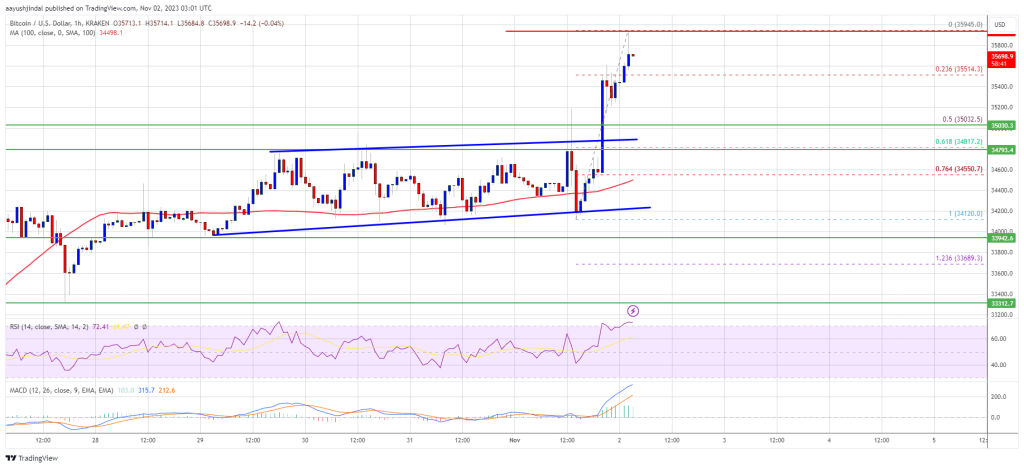
There was a break above a rising channel with resistance at $34,850 on the hourly chart. The bulls were able to pump the price above the last swing high and $35,500. It traded to a new multi-week high at $35,945 and is still showing positive signs.
Bitcoin is now trading above $34,260 and the 100 hourly Simple moving average. It is also well above the 23.6% Fib retracement level of the recent increase from the $34,120 swing low to the $35,945 high.
On the upside, immediate resistance is near the $35,950 level. The next key resistance could be near $36,200. A clear move above the $36,200 resistance might open the doors for a decent 5% increase toward the $37,000 resistance.
Source: BTCUSD on TradingView.com
The next key resistance could be $37,500, above which the price could rise toward $38,000. Any more gains might send BTC toward the $38,800 level.
If Bitcoin fails to rise above the $35,950 resistance zone, it could start a downside correction. Immediate support on the downside is near the $35,500 level.
The next major support is near the $35,000 level or the 50% Fib retracement level of the recent increase from the $34,120 swing low to the $35,945 high. If there is a move below $35,000, there is a risk of more downsides. In the stated case, the price could drop toward the $34,500 level or the 100 hourly Simple moving average.
Technical indicators:
Hourly MACD – The MACD is now gaining pace in the bullish zone.
Hourly RSI (Relative Strength Index) – The RSI for BTC/USD is now in the overbought zone.
Major Support Levels – $35,500, followed by $35,000.
Major Resistance Levels – $35,950, $36,200, and $37,000.
[#item_full_content]NewsBTCRead MoreBloomberg's Mike McGlone has reiterated his forecast that Bitcoin could plunge to $10,000, this time…
Bitcoin price started a decent increase above the $68,000 zone. BTC is now showing positive…
Most simplifies the complex process of quantum computing as "it can be 0 and 1…
A popular crypto trader has come forward on the social media platform X to predict…
Bitcoin's correlation with global central bank easing has turned strongly negative since 2024, suggesting BTC…
Social sentiment, on-chain data, and positioning metrics all hit extremes not seen since late February,…