Bitcoin price climbed further higher above $21,000. BTC is rising and might aim a move towards the $22,000 resistance zone in the near term.
Bitcoin climbed further higher above the $20,000 and $20,500 resistance levels.
The price is trading above $20,200 and the 100 hourly simple moving average.
There is a major bullish trend line forming with support near $20,500 on the hourly chart of the BTC/USD pair (data feed from Kraken).
The pair could rise further above the $21,500 resistance zone in the near term.
Bitcoin price gained a strong bullish momentum and settled above the $20,000 resistance zone. BTC even climbed above the $20,500 level to move into a positive zone.
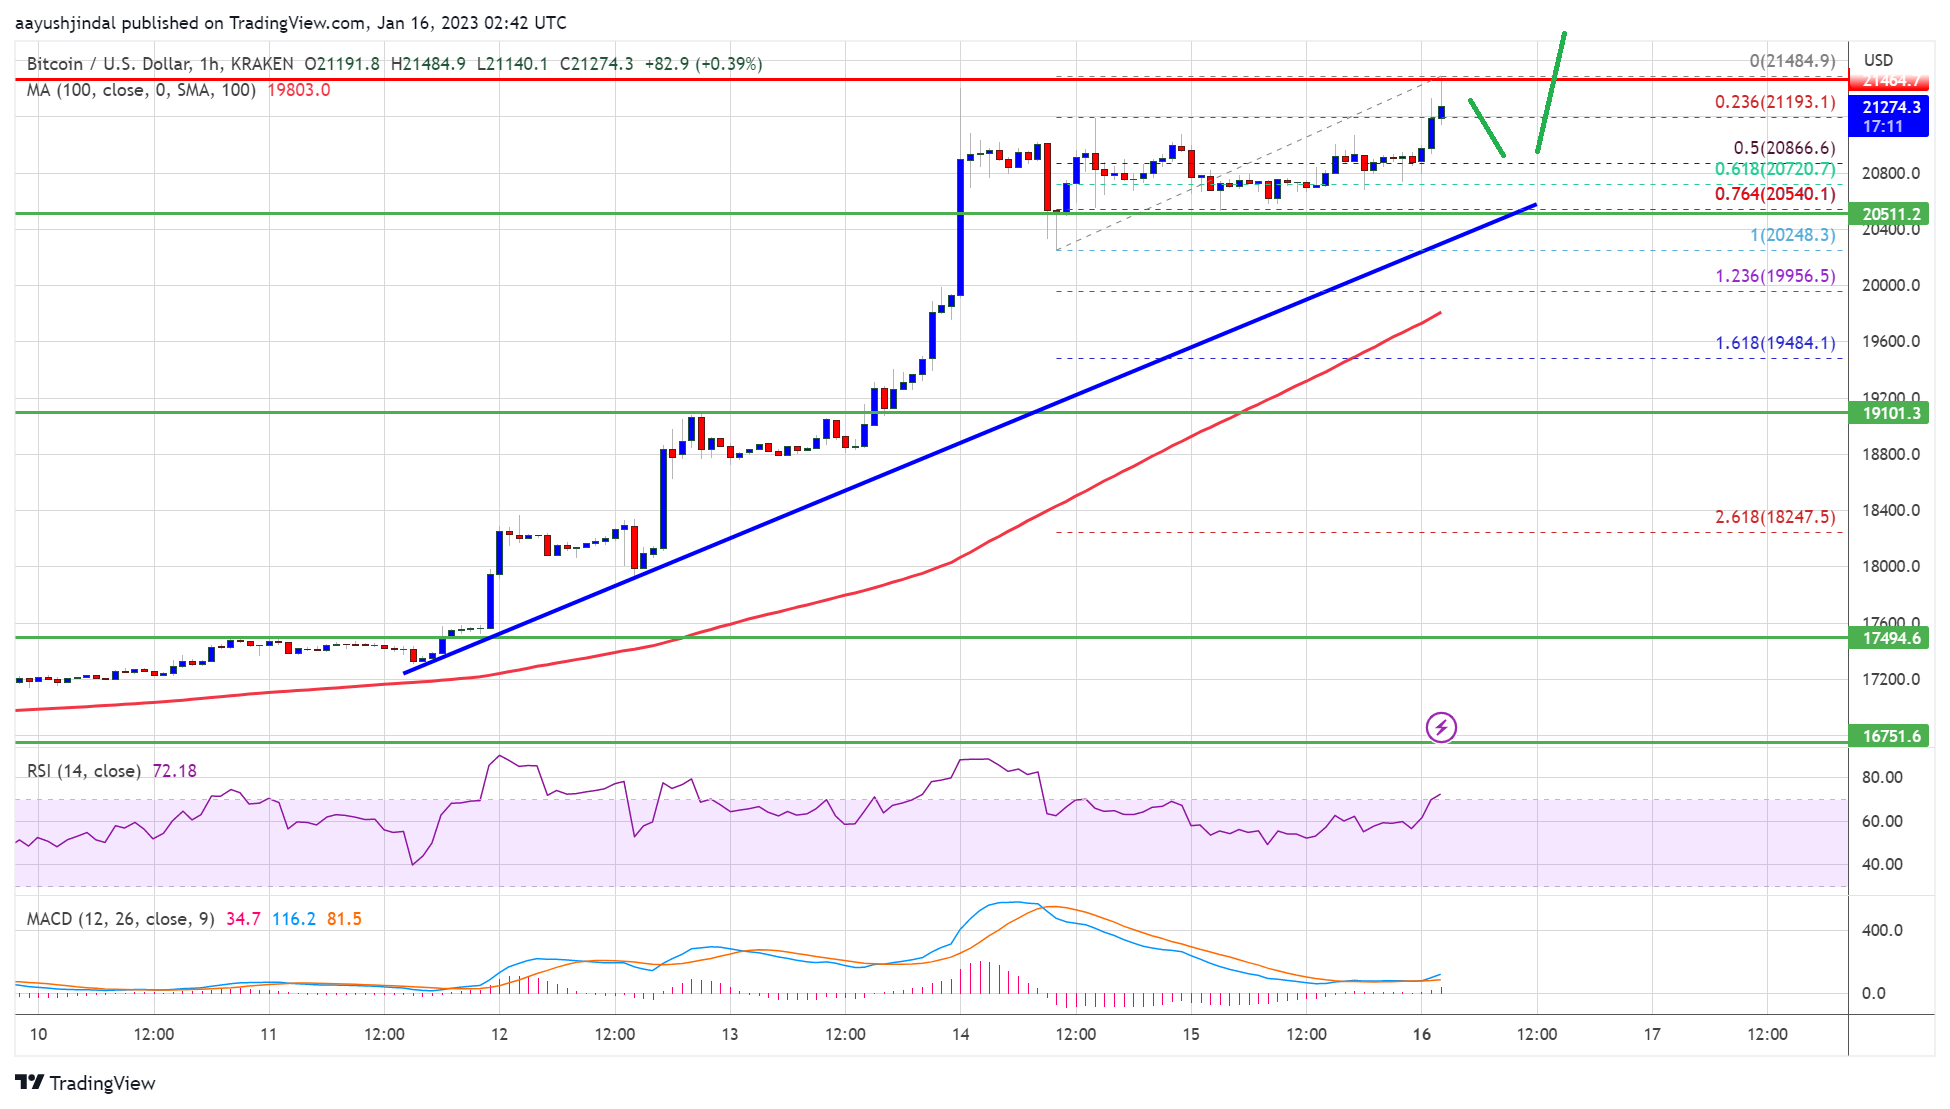
The price consolidated for some time above the $20,500 level. A high is formed near $21,484 and the price is now showing signs of more upsides. It is now trading above $20,200 and the 100 hourly simple moving average. There is also a major bullish trend line forming with support near $20,500 on the hourly chart of the BTC/USD pair.
It is also trading above the 23.6% Fib retracement level of the upward move from the $20,248 swing low to $21,484 high. On the upside, an immediate resistance is near the $21,500 level.
Source: BTCUSD on TradingView.com
The next major resistance is near the $21,850 zone, above which the price might start another steady increase. In the stated case, the price may perhaps rise towards the $22,000 level. Any more gains might send btc price towards the $22,500 level.
If bitcoin price fails to clear the $21,500 resistance, it could start a downside correction. An immediate support on the downside is near the $21,000 level.
The next major support is near the $20,500 level and the trend line. It is near the 61.8% Fib retracement level of the upward move from the $20,248 swing low to $21,484 high. The main support is now forming near the $20,200 level, below which the price might retest $19,000.
Technical indicators:
Hourly MACD – The MACD is now gaining pace in the bullish zone.
Hourly RSI (Relative Strength Index) – The RSI for BTC/USD is now above the 50 level.
Major Support Levels – $20,500, followed by $20,200.
Major Resistance Levels – $21,500, $22,000 and $22,500.
Bitcoin price climbed further higher above $21,000. BTC is rising and might aim a move towards the $22,000 resistance zone in the near term.
Bitcoin climbed further higher above the $20,000 and $20,500 resistance levels.
The price is trading above $20,200 and the 100 hourly simple moving average.
There is a major bullish trend line forming with support near $20,500 on the hourly chart of the BTC/USD pair (data feed from Kraken).
The pair could rise further above the $21,500 resistance zone in the near term.
Bitcoin price gained a strong bullish momentum and settled above the $20,000 resistance zone. BTC even climbed above the $20,500 level to move into a positive zone.
The price consolidated for some time above the $20,500 level. A high is formed near $21,484 and the price is now showing signs of more upsides. It is now trading above $20,200 and the 100 hourly simple moving average. There is also a major bullish trend line forming with support near $20,500 on the hourly chart of the BTC/USD pair.
It is also trading above the 23.6% Fib retracement level of the upward move from the $20,248 swing low to $21,484 high. On the upside, an immediate resistance is near the $21,500 level.
Source: BTCUSD on TradingView.com
The next major resistance is near the $21,850 zone, above which the price might start another steady increase. In the stated case, the price may perhaps rise towards the $22,000 level. Any more gains might send btc price towards the $22,500 level.
If bitcoin price fails to clear the $21,500 resistance, it could start a downside correction. An immediate support on the downside is near the $21,000 level.
The next major support is near the $20,500 level and the trend line. It is near the 61.8% Fib retracement level of the upward move from the $20,248 swing low to $21,484 high. The main support is now forming near the $20,200 level, below which the price might retest $19,000.
Technical indicators:
Hourly MACD – The MACD is now gaining pace in the bullish zone.
Hourly RSI (Relative Strength Index) – The RSI for BTC/USD is now above the 50 level.
Major Support Levels – $20,500, followed by $20,200.
Major Resistance Levels – $21,500, $22,000 and $22,500.
Tags: bitcoinbitcoin pricebtcusdBTCUSDTxbtusd
NewsBTCRead More
The Wall Street investment bank cited slower ETF flows, weak network activity and a narrowing…
The company sold 4,451 BTC in February to cut debt and fund AI infrastructure pivot.Read…
Your day-ahead look for March 17, 2026Read MoreCoinDesk: Bitcoin, Ethereum, Crypto News and Price Data[#item_full_content]
Crypto markets cooled after Monday's rally, with bitcoin eyeing support near $72,000–$74,000 even as derivatives…
Bitcoin’s foray above $70,000, while encouraging, has not really done much to quell the expectations…
Historical trends point to upside potential, but 2022 parallels and cycle dynamics suggest caution.Read MoreCoinDesk:…