Bitcoin price started a fresh increase from the $22,400 support zone. BTC climbed to a new yearly high and now aims more upsides above $24,000.
Bitcoin started a fresh increase after forming a base near the $22,400 support zone.
The price is trading above $23,000 and the 100 hourly simple moving average.
There was a break above a major bearish trend line with resistance near $23,000 on the hourly chart of the BTC/USD pair (data feed from Kraken).
The pair could start a fresh increase if it stays above the $23,000 support zone.
Bitcoin price saw a downside correction below the $23,000 level. However, BTC remained well bid near the $22,400 support zone. A low was formed near $22,341 and the price started a fresh increase.
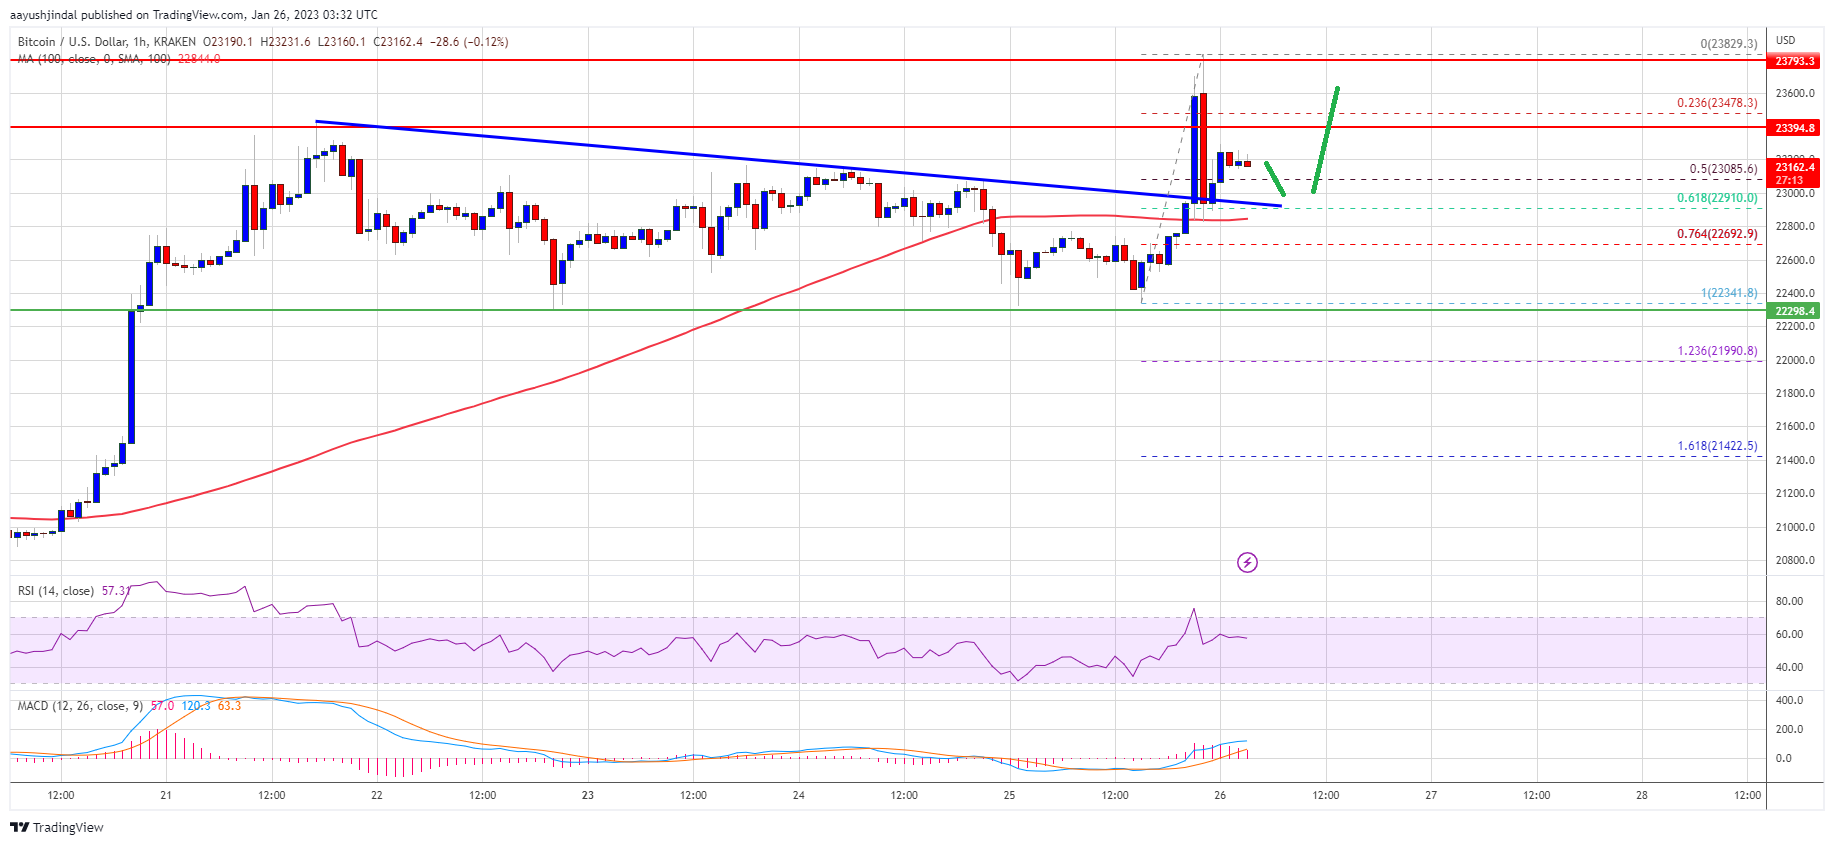
There was a clear move above the $23,000 resistance zone. Besides, there was a break above a major bearish trend line with resistance near $23,000 on the hourly chart of the BTC/USD pair. The pair surged to a new yearly high at $23,829 and is currently correcting gains.
There was a move below the 50% Fib retracement level of the recent increase from the $22,341 swing low to $23,829 high. However, the bulls appeared near the $23,200 support zone.
Bitcoin price is now trading above $23,000 and the 100 hourly simple moving average. It is also above the 61.8% Fib retracement level of the recent increase from the $22,341 swing low to $23,829 high. An immediate resistance is near the $23,400 level.
Source: BTCUSD on TradingView.com
The next major resistance is near the $23,850 zone, above which the price might gain bullish momentum. In the stated case, the price may perhaps rise towards the $24,200 level. The next resistance could be near the $24,500 level. Any more gains might send btc price towards the $25,000 level.
If bitcoin price fails to clear the $23,400 resistance, it could continue to move down. An immediate support on the downside is near the $23,000 zone.
The next major support is near the $22,850 zone. A downside break below the $22,850 level might send the price towards the $22,500 level. Any more losses might send the price to $22,350 in the near term.
Technical indicators:
Hourly MACD – The MACD is now losing pace in the bullish zone.
Hourly RSI (Relative Strength Index) – The RSI for BTC/USD is now above the 50 level.
Major Support Levels – $23,000, followed by $22,850.
Major Resistance Levels – $23,400, $23,850 and $24,200.
Bitcoin price started a fresh increase from the $22,400 support zone. BTC climbed to a new yearly high and now aims more upsides above $24,000.
Bitcoin started a fresh increase after forming a base near the $22,400 support zone.
The price is trading above $23,000 and the 100 hourly simple moving average.
There was a break above a major bearish trend line with resistance near $23,000 on the hourly chart of the BTC/USD pair (data feed from Kraken).
The pair could start a fresh increase if it stays above the $23,000 support zone.
Bitcoin price saw a downside correction below the $23,000 level. However, BTC remained well bid near the $22,400 support zone. A low was formed near $22,341 and the price started a fresh increase.
There was a clear move above the $23,000 resistance zone. Besides, there was a break above a major bearish trend line with resistance near $23,000 on the hourly chart of the BTC/USD pair. The pair surged to a new yearly high at $23,829 and is currently correcting gains.
There was a move below the 50% Fib retracement level of the recent increase from the $22,341 swing low to $23,829 high. However, the bulls appeared near the $23,200 support zone.
Bitcoin price is now trading above $23,000 and the 100 hourly simple moving average. It is also above the 61.8% Fib retracement level of the recent increase from the $22,341 swing low to $23,829 high. An immediate resistance is near the $23,400 level.
Source: BTCUSD on TradingView.com
The next major resistance is near the $23,850 zone, above which the price might gain bullish momentum. In the stated case, the price may perhaps rise towards the $24,200 level. The next resistance could be near the $24,500 level. Any more gains might send btc price towards the $25,000 level.
If bitcoin price fails to clear the $23,400 resistance, it could continue to move down. An immediate support on the downside is near the $23,000 zone.
The next major support is near the $22,850 zone. A downside break below the $22,850 level might send the price towards the $22,500 level. Any more losses might send the price to $22,350 in the near term.
Technical indicators:
Hourly MACD – The MACD is now losing pace in the bullish zone.
Hourly RSI (Relative Strength Index) – The RSI for BTC/USD is now above the 50 level.
Major Support Levels – $23,000, followed by $22,850.
Major Resistance Levels – $23,400, $23,850 and $24,200.
Tags: bitcoinbitcoin pricebtcusdBTCUSDTxbtusd
NewsBTCRead More
Bitcoin fell below $67,000 and ether dropped toward $2,000 as equities weakened, oil topped $100…
Your day-ahead look for March 27, 2026Read MoreCoinDesk: Bitcoin, Ethereum, Crypto News and Price Data[#item_full_content]
Glassnode data shows distribution across cohorts as BTC falls below $67,000, with whales remaining largely…
JPMorgan says the Iran war has produced an unusual market split: bitcoin is showing signs…
On‑chain trackers showed GameStop’s $324 million worth of bitcoin leaving its wallets for Coinbase. Many…
Liquidation heatmap shows large liquidity cluster around $66,000, signaling potential downside target.Read MoreCoinDesk: Bitcoin, Ethereum,…