Bitcoin price started another decline from the $67,000 zone. BTC is showing bearish signs and might soon revisit the $61,000 support zone.
Bitcoin failed to clear the $67,000 resistance zone.
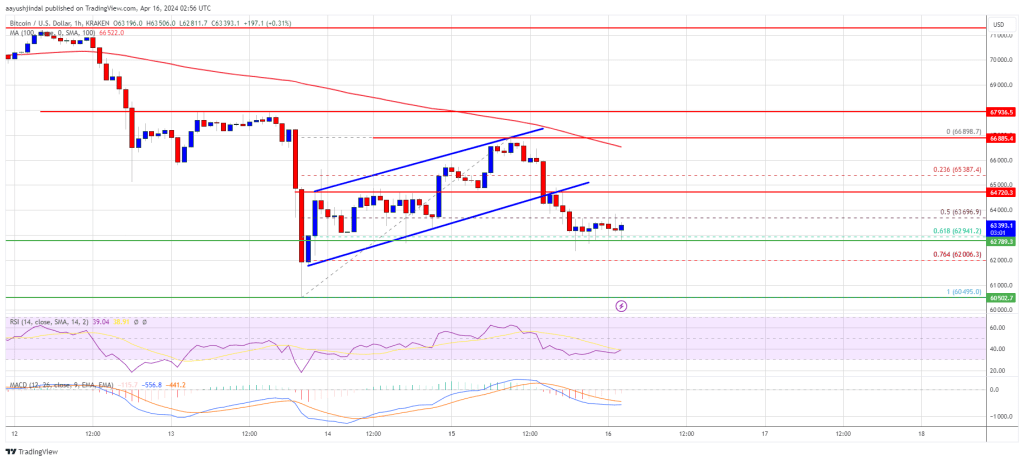
The price is trading below $65,000 and the 100 hourly Simple moving average.
There was a break below a rising channel with support at $64,900 on the hourly chart of the BTC/USD pair (data feed from Kraken).
The pair could extend its decline unless it clears the $65,000 resistance zone.
Bitcoin price attempted a recovery wave above the $65,000 resistance zone. BTC even climbed above $66,200, but the bears were active near the $67,000 zone.
A high was formed at $66,898 and the price started another decline amid rising tensions between Israel and Iran. There was a move below the $65,000 and $64,000 levels. The price traded below the 50% Fib retracement level of the upward move from the $60,495 swing low to the $66,898 high.
There was a break below a rising channel with support at $64,900 on the hourly chart of the BTC/USD pair. Bitcoin is now trading below $65,000 and the 100 hourly Simple moving average. The bulls are now protecting the 61.8% Fib retracement level of the upward move from the $60,495 swing low to the $66,898 high at $63,000.
Immediate resistance is near the $63,750 level. The first major resistance could be $64,700. The next resistance now sits at $65,000. If there is a clear move above the $65,000 resistance zone, the price could continue to move up. In the stated case, the price could rise toward $66,800 and the 100 hourly Simple moving average.
Source: BTCUSD on TradingView.com
The next major resistance is near the $67,200 zone. Any more gains might send Bitcoin toward the $70,000 resistance zone in the near term.
If Bitcoin fails to rise above the $65,000 resistance zone, it could start another decline. Immediate support on the downside is near the $63,000 level.
The first major support is $62,000. If there is a close below $62,000, the price could start to drop toward the $61,000 level. Any more losses might send the price toward the $60,500 support zone in the near term.
Technical indicators:
Hourly MACD – The MACD is now losing pace in the bearish zone.
Hourly RSI (Relative Strength Index) – The RSI for BTC/USD is now below the 50 level.
Major Support Levels – $63,000, followed by $62,000.
Major Resistance Levels – $64,700, $65,000, and $67,000.
[#item_full_content]NewsBTCRead MoreBitcoin price failed to extend its recovery wave above the $70,500 zone. BTC is now…
Bitcoin Magazine Coinbase CPO Rejects Claims of Opposing Bitcoin Tax Relief as Jack Dorsey Demands…
The security architecture surrounding Bitcoin continues to evolve as new infrastructure emerges to support self-custody…
Bitcoin is up about 7% from the Sunday lows, even as equities and gold tread…
Bitcoin Magazine Cosmos Health (COSM) Buys $600K in Bitcoin, Expands Digital Asset Treasury Cosmos Health…
Bitcoin Magazine Bitcoin is Now a Global Financial Player as Institutions Take the Helm: Bitwise…