Bitcoin price is struggling to clear the $17,000 resistance zone. BTC must stay above $16,000 to avoid more losses in the near term.
Bitcoin is still consolidating above the $16,350 and $16,000 support levels.
The price is trading just above $16,500 and the 100 hourly simple moving average.
There is a major bearish trend line forming with resistance near $16,750 on the hourly chart of the BTC/USD pair (data feed from Kraken).
The pair could start a recovery wave if it clears the $17,000 resistance zone.
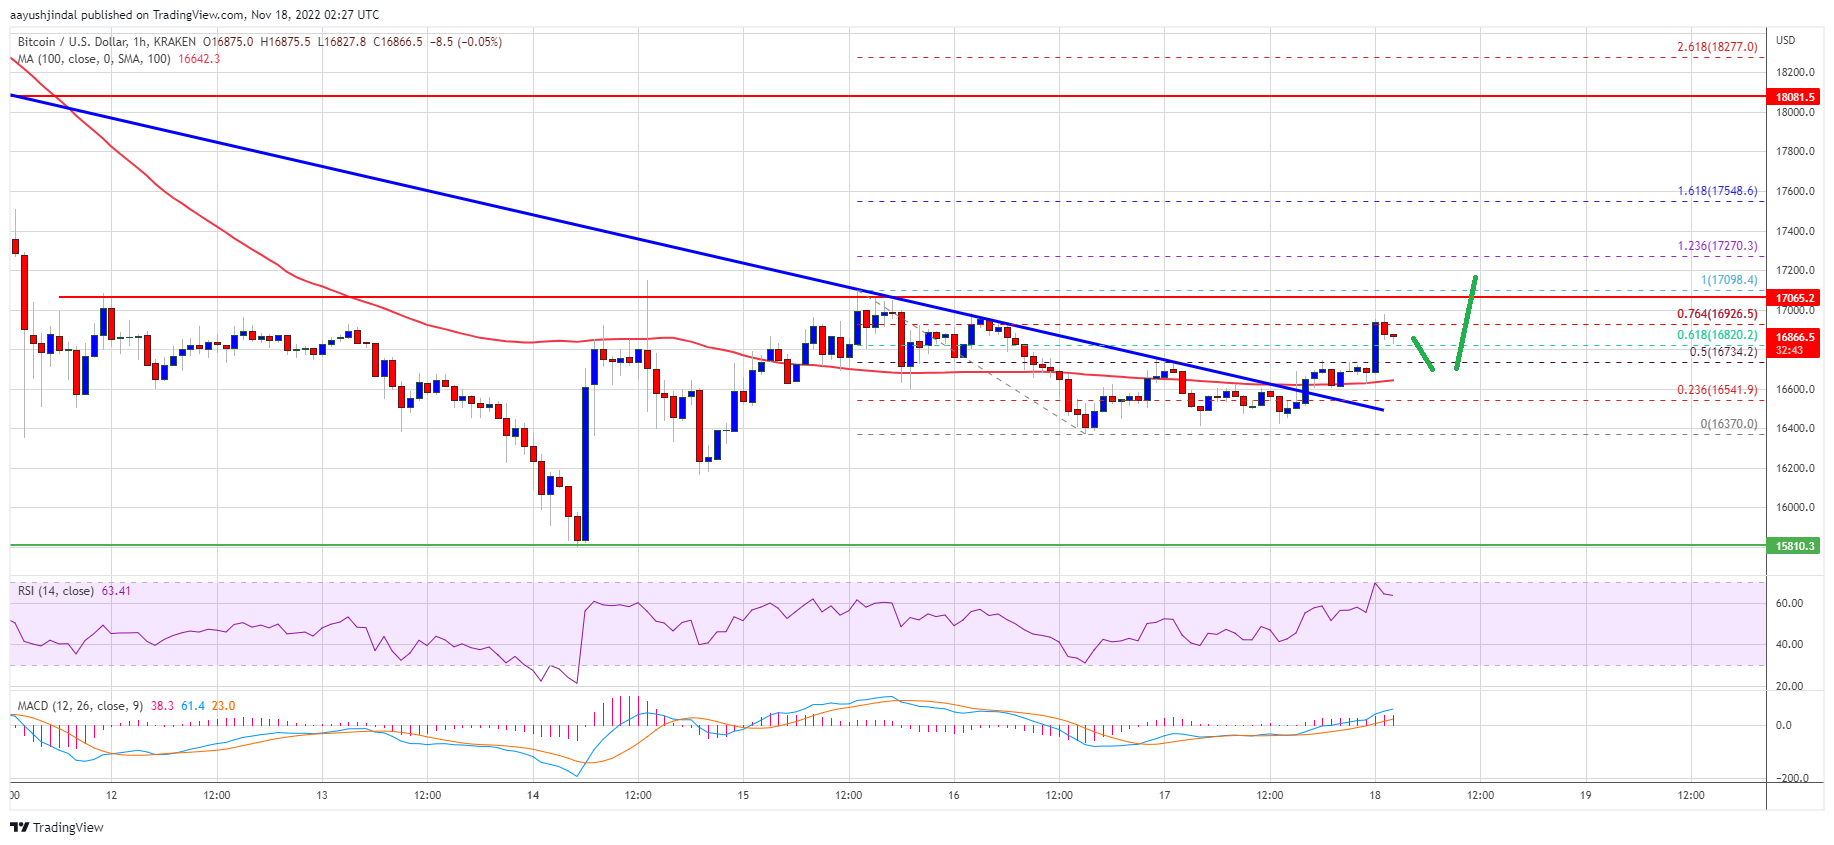
Bitcoin price made an attempt to gain strength above the $17,000 resistance zone. However, BTC struggled to remain stable above the $17,000 level.
The price traded as high as $17,098 and recently started a slow decline. There was a move below the $16,800 and $16,650 levels. The price declined below the 23.6% Fib retracement level of the upward move from the $15,833 swing low to $17,098 high.
The price even spiked below the $16,500 level. However, the bulls were active near the 50% Fib retracement level of the upward move from the $15,833 swing low to $17,098 high.
Bitcoin price is now trading just above $16,500 and the 100 hourly simple moving average. On the upside, an immediate resistance is near the $16,750 level. There is also a major bearish trend line forming with resistance near $16,750 on the hourly chart of the BTC/USD pair.
The first major resistance is near the $17,000 zone. A clear move above the $17,000 resistance could set the pace for a decent recovery wave.
Source: BTCUSD on TradingView.com
The next major resistance is near $17,500, above which the price could rise towards the $18,000 zone. Any more gains might send the price towards the $18,500 resistance zone.
If bitcoin fails to gain pace above the $17,000 resistance zone, it could continue to move down. An immediate support on the downside is near the $16,600 level and the 100 hourly SMA.
The next major support is near the $16,350 zone. The main support is near the $16,000 zone. A clear move below the $16,000 support might spark another major decline in the near term.
Technical indicators:
Hourly MACD – The MACD is now gaining pace in the bullish zone.
Hourly RSI (Relative Strength Index) – The RSI for BTC/USD is now above the 50 level.
Major Support Levels – $16,350, followed by $16,000.
Major Resistance Levels – $16,750, $17,000 and $17,500.
Bitcoin price is struggling to clear the $17,000 resistance zone. BTC must stay above $16,000 to avoid more losses in the near term.
Bitcoin is still consolidating above the $16,350 and $16,000 support levels.
The price is trading just above $16,500 and the 100 hourly simple moving average.
There is a major bearish trend line forming with resistance near $16,750 on the hourly chart of the BTC/USD pair (data feed from Kraken).
The pair could start a recovery wave if it clears the $17,000 resistance zone.
Bitcoin price made an attempt to gain strength above the $17,000 resistance zone. However, BTC struggled to remain stable above the $17,000 level.
The price traded as high as $17,098 and recently started a slow decline. There was a move below the $16,800 and $16,650 levels. The price declined below the 23.6% Fib retracement level of the upward move from the $15,833 swing low to $17,098 high.
The price even spiked below the $16,500 level. However, the bulls were active near the 50% Fib retracement level of the upward move from the $15,833 swing low to $17,098 high.
Bitcoin price is now trading just above $16,500 and the 100 hourly simple moving average. On the upside, an immediate resistance is near the $16,750 level. There is also a major bearish trend line forming with resistance near $16,750 on the hourly chart of the BTC/USD pair.
The first major resistance is near the $17,000 zone. A clear move above the $17,000 resistance could set the pace for a decent recovery wave.
Source: BTCUSD on TradingView.com
The next major resistance is near $17,500, above which the price could rise towards the $18,000 zone. Any more gains might send the price towards the $18,500 resistance zone.
If bitcoin fails to gain pace above the $17,000 resistance zone, it could continue to move down. An immediate support on the downside is near the $16,600 level and the 100 hourly SMA.
The next major support is near the $16,350 zone. The main support is near the $16,000 zone. A clear move below the $16,000 support might spark another major decline in the near term.
Technical indicators:
Hourly MACD – The MACD is now gaining pace in the bullish zone.
Hourly RSI (Relative Strength Index) – The RSI for BTC/USD is now above the 50 level.
Major Support Levels – $16,350, followed by $16,000.
Major Resistance Levels – $16,750, $17,000 and $17,500.
Tags: bitcoinbtcusdBTCUSDTxbtusd
NewsBTCRead More
A brutal crypto selloff erased $2.6 billion in leveraged bets, sent bitcoin to $60,000 and…
Your day-ahead look for Feb. 6, 2026Read MoreCoinDesk: Bitcoin, Ethereum, Crypto News and Price Data[#item_full_content]
Earnings disappointments weigh on AI related tech, while crypto sentiment improves on bitcoin’s rebound.Read MoreCoinDesk:…
Bitcoin’s role in big-money talks has shifted in recent weeks. Reports say analysts at JPMorgan…
What to Know: Metaplanet’s aggressive Bitcoin accumulation strategy confirms a growing trend of corporate treasury…
Bitcoin is on course to see five red months in a row, as it is…