Bitcoin price is struggling to clear the $17,000 resistance zone. BTC must stay above $16,000 to avoid more losses in the near term.
Bitcoin is still consolidating above the $16,350 and $16,000 support levels.
The price is trading just above $16,500 and the 100 hourly simple moving average.
There is a major bearish trend line forming with resistance near $16,750 on the hourly chart of the BTC/USD pair (data feed from Kraken).
The pair could start a recovery wave if it clears the $17,000 resistance zone.
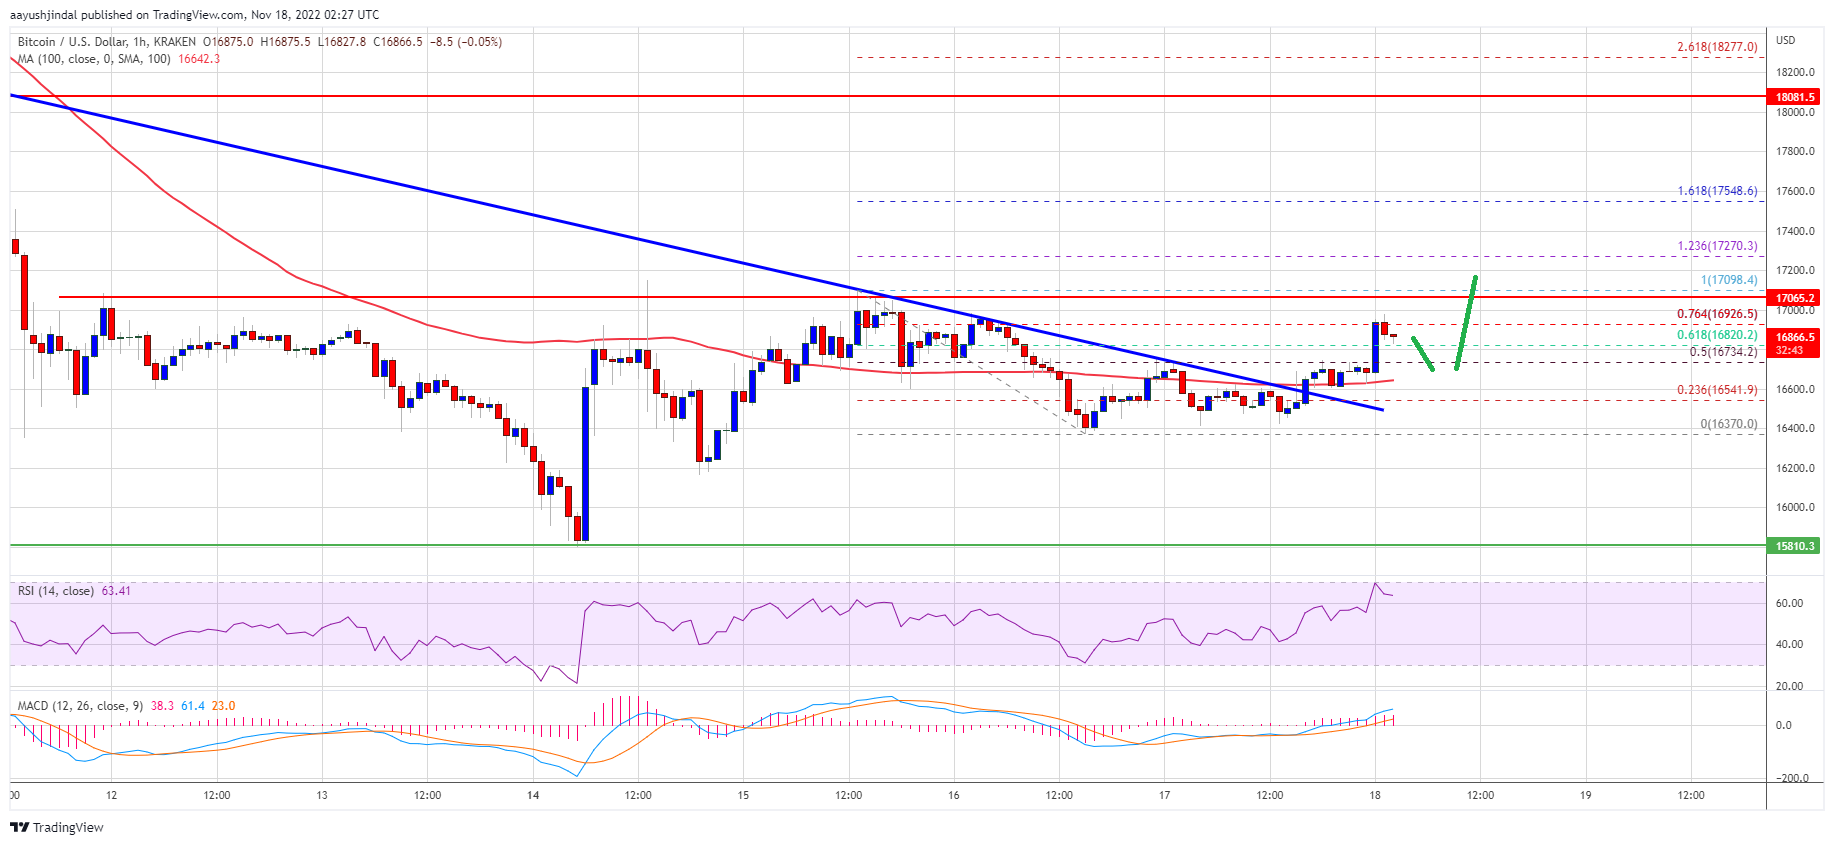
Bitcoin price made an attempt to gain strength above the $17,000 resistance zone. However, BTC struggled to remain stable above the $17,000 level.
The price traded as high as $17,098 and recently started a slow decline. There was a move below the $16,800 and $16,650 levels. The price declined below the 23.6% Fib retracement level of the upward move from the $15,833 swing low to $17,098 high.
The price even spiked below the $16,500 level. However, the bulls were active near the 50% Fib retracement level of the upward move from the $15,833 swing low to $17,098 high.
Bitcoin price is now trading just above $16,500 and the 100 hourly simple moving average. On the upside, an immediate resistance is near the $16,750 level. There is also a major bearish trend line forming with resistance near $16,750 on the hourly chart of the BTC/USD pair.
The first major resistance is near the $17,000 zone. A clear move above the $17,000 resistance could set the pace for a decent recovery wave.
Source: BTCUSD on TradingView.com
The next major resistance is near $17,500, above which the price could rise towards the $18,000 zone. Any more gains might send the price towards the $18,500 resistance zone.
If bitcoin fails to gain pace above the $17,000 resistance zone, it could continue to move down. An immediate support on the downside is near the $16,600 level and the 100 hourly SMA.
The next major support is near the $16,350 zone. The main support is near the $16,000 zone. A clear move below the $16,000 support might spark another major decline in the near term.
Technical indicators:
Hourly MACD – The MACD is now gaining pace in the bullish zone.
Hourly RSI (Relative Strength Index) – The RSI for BTC/USD is now above the 50 level.
Major Support Levels – $16,350, followed by $16,000.
Major Resistance Levels – $16,750, $17,000 and $17,500.
Bitcoin price is struggling to clear the $17,000 resistance zone. BTC must stay above $16,000 to avoid more losses in the near term.
Bitcoin is still consolidating above the $16,350 and $16,000 support levels.
The price is trading just above $16,500 and the 100 hourly simple moving average.
There is a major bearish trend line forming with resistance near $16,750 on the hourly chart of the BTC/USD pair (data feed from Kraken).
The pair could start a recovery wave if it clears the $17,000 resistance zone.
Bitcoin price made an attempt to gain strength above the $17,000 resistance zone. However, BTC struggled to remain stable above the $17,000 level.
The price traded as high as $17,098 and recently started a slow decline. There was a move below the $16,800 and $16,650 levels. The price declined below the 23.6% Fib retracement level of the upward move from the $15,833 swing low to $17,098 high.
The price even spiked below the $16,500 level. However, the bulls were active near the 50% Fib retracement level of the upward move from the $15,833 swing low to $17,098 high.
Bitcoin price is now trading just above $16,500 and the 100 hourly simple moving average. On the upside, an immediate resistance is near the $16,750 level. There is also a major bearish trend line forming with resistance near $16,750 on the hourly chart of the BTC/USD pair.
The first major resistance is near the $17,000 zone. A clear move above the $17,000 resistance could set the pace for a decent recovery wave.
Source: BTCUSD on TradingView.com
The next major resistance is near $17,500, above which the price could rise towards the $18,000 zone. Any more gains might send the price towards the $18,500 resistance zone.
If bitcoin fails to gain pace above the $17,000 resistance zone, it could continue to move down. An immediate support on the downside is near the $16,600 level and the 100 hourly SMA.
The next major support is near the $16,350 zone. The main support is near the $16,000 zone. A clear move below the $16,000 support might spark another major decline in the near term.
Technical indicators:
Hourly MACD – The MACD is now gaining pace in the bullish zone.
Hourly RSI (Relative Strength Index) – The RSI for BTC/USD is now above the 50 level.
Major Support Levels – $16,350, followed by $16,000.
Major Resistance Levels – $16,750, $17,000 and $17,500.
NewsBTCRead More
Bitcoin quietly gained ground while gold crumbled. That contrast has become one of the more…
Despite stabilizing spot prices, investors remain defensive, with leveraged speculation cooling and realized volatility dropping…
Crypto analyst Ardi has pointed to a bear market divergence to explain what has been…
Bitcoin is hovering near the $71,000 mark, consolidating after recent swings as the market digests…
First-quarter purchases have reached 89,618 BTC so far, the most since fourth-quarter 2024, and the…
Bitcoin (BTC) is showing early signs of a prolonged decline after peaking in October 2025.…