Bitcoin price is still struggling to clear the $70,000 resistance. BTC is slowly moving lower and might soon drop toward the $67,000 support.
Bitcoin price is struggling to clear the $69,500 and $70,000 levels.
The price is trading above $68,000 and the 100 hourly Simple moving average.
There is a key bullish trend line forming with support at $68,000 on the hourly chart of the BTC/USD pair (data feed from Kraken).
The pair could continue to move down and trade toward the $67,000 support zone.
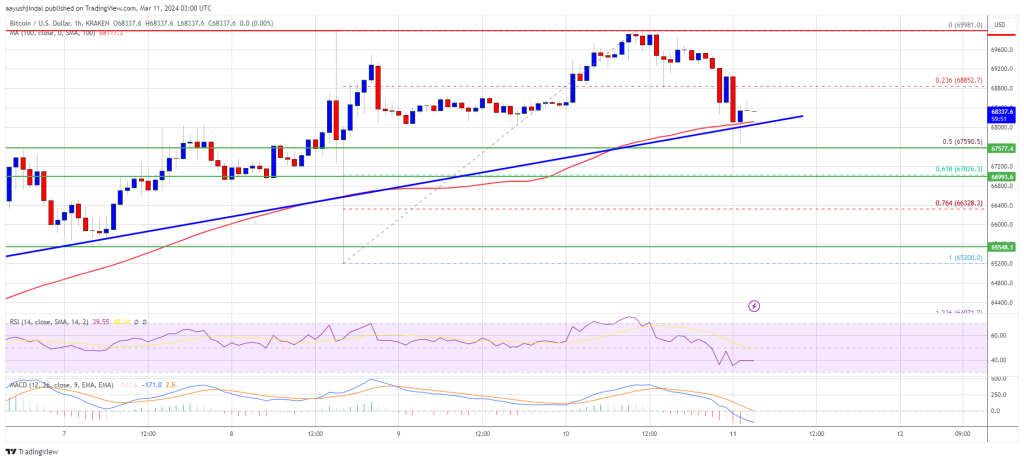
Bitcoin price made another attempt to gain strength above the $69,000 level. BTC cleared the $69,500 level, but the bears were active near the $70,000 resistance zone.
A high was formed at $69,981 and the price started a downside correction. There was a move below the $69,500 and $69,200 levels. The price declined below the 23.6% Fib retracement level of the upward wave from the $65,200 swing low to the $69,981 high.
Bitcoin is now trading above $68,000 and the 100 hourly Simple moving average. There is also a key bullish trend line forming with support at $68,000 on the hourly chart of the BTC/USD pair. The trend line is close to the 50% Fib retracement level of the upward wave from the $65,200 swing low to the $69,981 high.
Immediate resistance is near the $68,850 level. The next key resistance could be $69,200, above which the price could rise toward the $69,500 resistance zone.
Source: BTCUSD on TradingView.com
If there is a clear move above the $69,500 resistance zone, the price could even attempt a move above the $70,000 resistance zone. Any more gains might send the price toward the $72,000 level.
If Bitcoin fails to rise above the $68,850 resistance zone, it could start another decline. Immediate support on the downside is near the $68,000 level and the trend line.
The first major support is $67,000. If there is a close below $67,000, the price could start a decent pullback toward the $65,500 level. Any more losses might send the price toward the $64,400 support zone.
Technical indicators:
Hourly MACD – The MACD is now gaining pace in the bearish zone.
Hourly RSI (Relative Strength Index) – The RSI for BTC/USD is now below the 50 level.
Major Support Levels – $68,000, followed by $67,000.
Major Resistance Levels – $68,850, $69,200, and $69,500.
[#item_full_content]NewsBTCRead MoreWhat to Know: Marathon Digital moved $87M in $BTC to exchanges, signaling potential sell pressure…
What to Know: Bitcoin executed a ‘whipsaw’ recovery, reclaiming $65K after volatility in the Asian…
Bitcoin printed one of the largest ever daily candles to the downside on Thursday, sliding…
Traders on X are pointing to everything from a Hong Kong fund blowup to yen…
Bitcoin is struggling to hold the $70,000 level as persistent selling pressure weighs on market…
The latest downturn in Bitcoin (BTC) has begun to weigh heavily on publicly listed companies…