Bitcoin price jumped toward $48,000 after the hacked SEC account tweet. BTC trimmed all gains, but the uptrend support is still intact near $45,200.
Bitcoin spiked toward the $47,800 and $48,000 resistance levels.
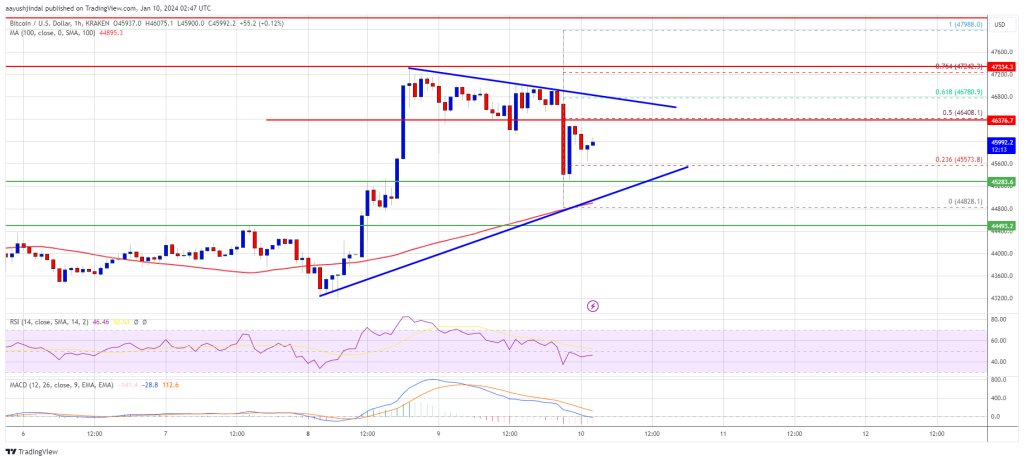
The price is trading above $45,500 and the 100 hourly Simple moving average.
There is a major contracting triangle forming with resistance near $46,800 on the hourly chart of the BTC/USD pair (data feed from Kraken).
The pair could continue to move up toward the $48,000 level unless there is a close below $45,000.
Bitcoin price started a fresh increase above the $45,500 resistance zone. BTC gained bullish momentum above the $46,000 and $46,500 levels after the hacked SEC account tweet about the ETF approval.
After clarification, there was a sharp rejection near the $48,000 zone. A high was formed near $47,988 before the price started a fresh decline. There was a move below the $47,000 and $46,500 levels. The price dived toward the $45,000 support.
A low was formed near $44,828 and the price is now rising. It is back above the 23.6% Fib retracement level of the recent decline from the $47,988 swing high to the $44,828 low.
Bitcoin is now trading above $45,500 and the 100 hourly Simple moving average. There is also a major contracting triangle forming with resistance near $46,800 on the hourly chart of the BTC/USD pair. On the upside, immediate resistance is near the $465,400 level. It is near the 50% Fib retracement level of the recent decline from the $47,988 swing high to the $44,828 low.
Source: BTCUSD on TradingView.com
The first major resistance is $46,800. A clear move above the $46,800 resistance could send the price toward the $47,200 resistance. The next resistance is now forming near the $48,000 level. A close above the $48,000 level could send the price further higher. The next major resistance sits at $49,250.
If Bitcoin fails to rise above the $46,800 resistance zone, it could start a fresh decline. Immediate support on the downside is near the $45,550 level.
The next major support is $45,200. If there is a move below $45,200, the price could gain bearish momentum. In the stated case, the price could drop toward the $44,800 support in the near term.
Technical indicators:
Hourly MACD – The MACD is now losing pace in the bearish zone.
Hourly RSI (Relative Strength Index) – The RSI for BTC/USD is now below the 50 level.
Major Support Levels – $45,500, followed by $45,200.
Major Resistance Levels – $46,400, $46,800, and $47,200.
[#item_full_content]NewsBTCRead MoreHistorical trends point to upside potential, but 2022 parallels and cycle dynamics suggest caution.Read MoreCoinDesk:…
Bitcoin's implied volatility holds steady as panic hedging drives traditional volatility indexes higher.Read MoreCoinDesk: Bitcoin,…
Bitcoin (BTC) has briefly surpassed the critical resistance level of $74,000, generating renewed optimism among…
Ether jumped 13%, XRP surged 11%, and solana gained 9.7% over seven days as $767…
Bitcoin briefly surged to a six-week high above $75,000 before quickly retreating, underscoring the fragility…
Bitcoin's move, led by unwinding of shorts, has lifted the broader crypto market, with the…