Bitcoin price attempted a fresh upside break above the $43,500 resistance. BTC failed and corrected lower to test the $41,800 support zone.
Bitcoin is correcting gains from the $43,500 resistance zone.
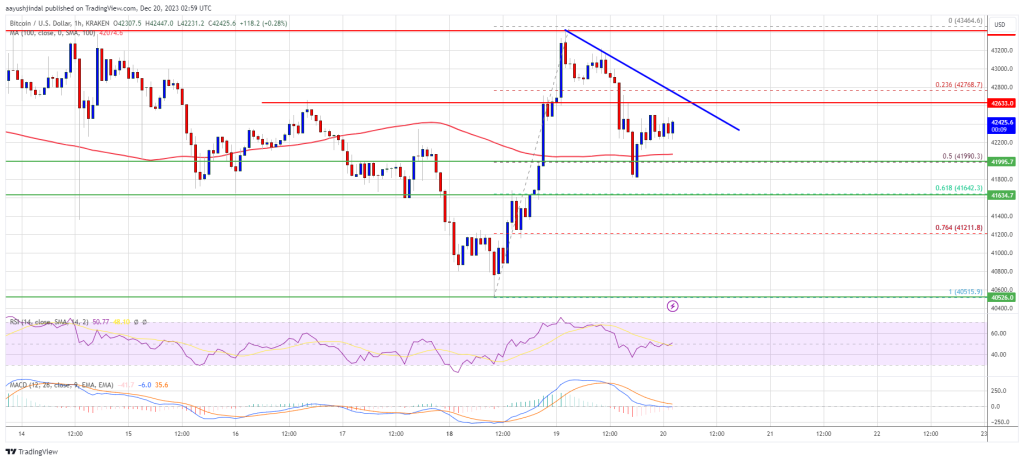
The price is trading above $42,000 and the 100 hourly Simple moving average.
There is a connecting bearish trend line forming with resistance near $42,600 on the hourly chart of the BTC/USD pair (data feed from Kraken).
The pair could continue to move down if there is a move below the $41,650 support.
Bitcoin price gained pace above the $42,000 resistance zone. BTC even climbed above the $43,000 level, but it faced a strong rejection near $43,500. It seems like the price failed again to clear the $43,500 zone.
A high was formed near $43,464 and the price started a fresh decline. There was a move below the $42,800 and $42,500 support levels. The price even spiked below the 50% Fib retracement level of the upward wave from the $40,514 swing low to the $43,464 high.
Bitcoin found support near the $41,800 level. It is now trading above $42,000 and the 100 hourly Simple moving average. The price is also stable above the 61.8% Fib retracement level of the upward wave from the $40,514 swing low to the $43,464 high.
On the upside, immediate resistance is near the $42,600 level. There is also a connecting bearish trend line forming with resistance near $42,600 on the hourly chart of the BTC/USD pair.
Source: BTCUSD on TradingView.com
The first major resistance is forming near $43,000. The main resistance is still near the $43,500 zone. A close above the $43,500 resistance might start a steady increase. The next key resistance could be near $44,500, above which BTC could rise toward the $45,000 level.
If Bitcoin fails to rise above the $42,650 resistance zone, it could continue to move down. Immediate support on the downside is near the $42,000 level.
The next major support is near $41,650. If there is a move below $41,650, there is a risk of more losses. In the stated case, the price could drop toward the $40,500 support in the near term.
Technical indicators:
Hourly MACD – The MACD is now gaining pace in the bearish zone.
Hourly RSI (Relative Strength Index) – The RSI for BTC/USD is now near the 50 level.
Major Support Levels – $42,000, followed by $41,650.
Major Resistance Levels – $42,650, $43,000, and $43,500.
[#item_full_content]NewsBTCRead MoreBitcoin had initially lost the $100,000 level back in November 2025, and since then, the…
Japan-based firm strengthens its position with nearly $400 million purchase, surpassing MARA Holdings in global…
Falling prices and prolonged consolidation are pushing public firms and sovereign holders to liquidate bitcoin…
While Ethereum (ETH) and XRP Exchange-Traded Funds (ETFs) ended March in negative territory, Bitcoin (BTC)…
Bitcoin and other risk assets have been whipsawed by President Donald J. Trump’s shifting rhetoric…
Bitcoin is struggling to reclaim $70,000. The price chart looks uninspiring. And according to the…