Bitcoin price made another attempt to clear the $36,000 resistance. BTC struggled again and is now correcting lower toward the $35,200 support.
Bitcoin again failed to clear the key $36,000 resistance zone.
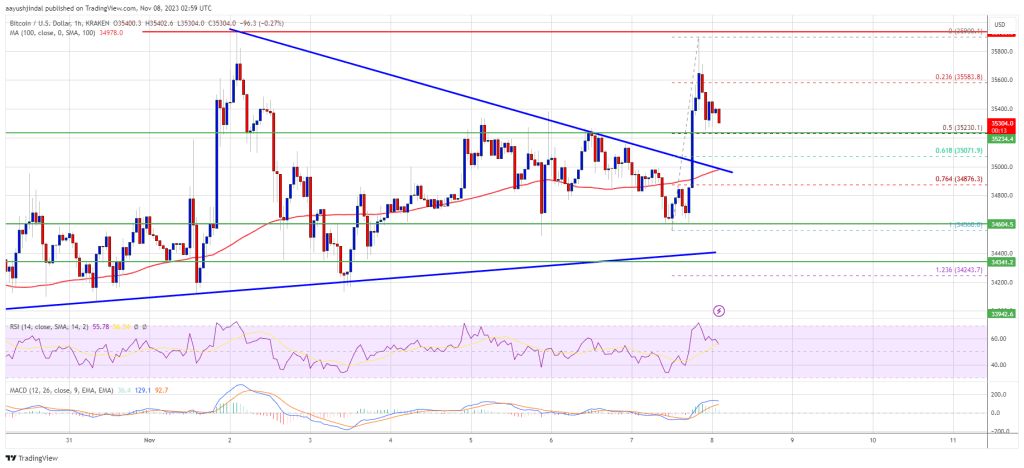
The price is trading above $35,000 and the 100 hourly Simple moving average.
There was a break above a major contracting triangle with resistance near $35,000 on the hourly chart of the BTC/USD pair (data feed from Kraken).
The pair is correcting gains and might find support near $35,200 or $35,000.
Bitcoin price remained stable above the $34,000 support zone. BTC attempted a fresh increase above the $35,250 resistance zone. There was a break above a major contracting triangle with resistance near $35,000 on the hourly chart.
It even cleared the $35,500 resistance, but the bears were active near the $36,000 zone. A high was formed near $35,900 and the price is again moving lower. There was a move below the $35,500 level. The price declined below the 23.6% Fib retracement level of the upward move from the $34,560 swing low to the $35,900 high.
Bitcoin is now trading above $35,000 and the 100 hourly Simple moving average. It seems to be approaching the $35,200 support or the 50% Fib retracement level of the upward move from the $34,560 swing low to the $35,900 high.
If it stays above $35,200, there might be a fresh increase. On the upside, immediate resistance is near the $35,560 level. The next key resistance could be near $35,900 or the recent high. The main resistance is still near $36,000. A clear move above the $36,000 resistance might open the doors for a move toward the $37,000 resistance.
Source: BTCUSD on TradingView.com
The next key resistance could be $37,500, above which the price could rise toward $38,000. Any more gains might send BTC toward the $38,800 level.
If Bitcoin fails to rise above the $35,560 resistance zone, it could continue to move down. Immediate support on the downside is near the $35,200 low.
The next major support is near the $35,000 zone or the 100 hourly SMA. If there is a move below $35,000, there is a risk of more downsides. In the stated case, the price could revisit the $34,000 support level in the near term.
Technical indicators:
Hourly MACD – The MACD is now losing pace in the bullish zone.
Hourly RSI (Relative Strength Index) – The RSI for BTC/USD is now above the 50 level.
Major Support Levels – $35,200, followed by $35,000.
Major Resistance Levels – $35,560, $35,900, and $36,000.
[#item_full_content]NewsBTCRead MoreBitcoin's move, led by unwinding of shorts, has lifted the broader crypto market, with the…
A short message from Michael Saylor has once again stirred speculation that Strategy could be…
Bitcoin price started a strong increase above the $75,000 zone. BTC is now consolidating and…
A potential US military strike on Iran’s main oil export terminal helped push Bitcoin to…
Bitcoin Magazine Bitcoin Price Surges Above $75,000 as Bullish Momentum Builds The bitcoin price climbed…
The alleged theft of 2,323 bitcoin has triggered a High Court dispute testing how English…