Bitcoin price recovered over $1,500 and climbed above $17,500. BTC failed to clear the $18,000 resistance and started a fresh decline.
Bitcoin started a recovery wave above the $17,000 and $17,200 resistance levels.
The price is trading below $18,500 and the 100 hourly simple moving average.
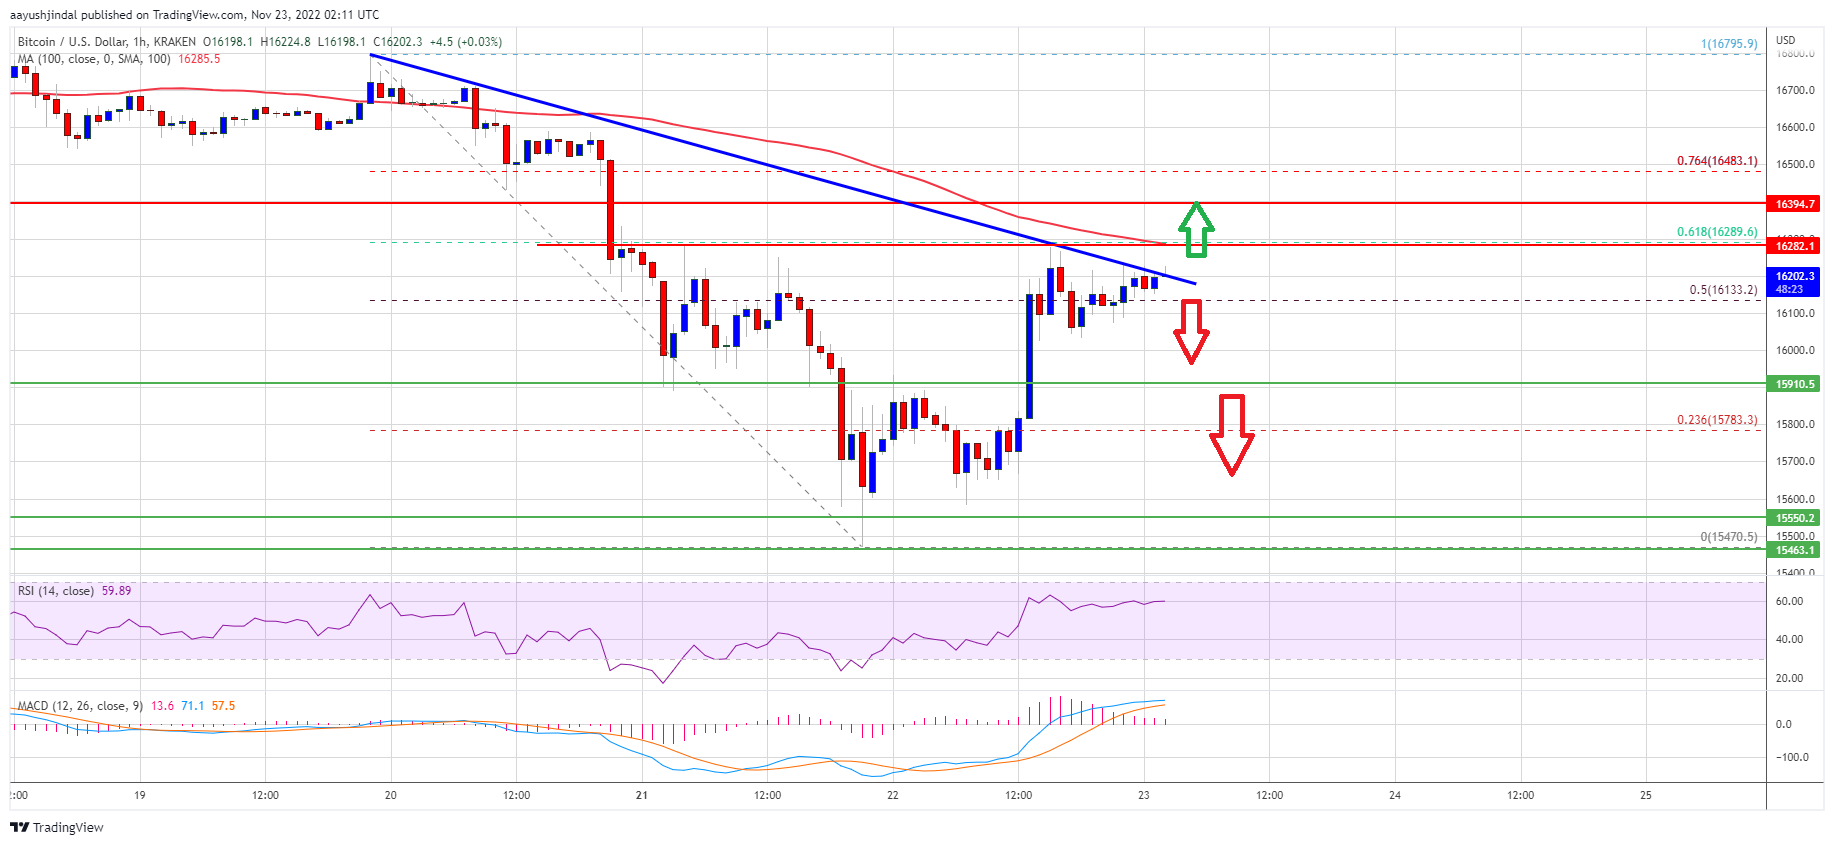
There is a key bullish trend line forming with support near $16,900 on the hourly chart of the BTC/USD pair (data feed from Kraken).
The pair could resume its decline if there is a close below the $16,750 support zone.
Bitcoin price declined heavily below the $18,000 support zone. FTX’s fall is still hurting the market and there was a strong decline towards the $16,000 support zone.
The price traded as low as $15,555 and recently started an upside correction, similar to ethereum, bnb, and ripple. There was a steady recovery wave above the $16,500 and $17,000 resistance levels. The price climbed above the 23.6% Fib retracement level of the main decline from the $20,670 swing high to $15,555 low. There is also a key bullish trend line forming with support near $16,900 on the hourly chart of the BTC/USD pair.
Bitcoin price also moved above the $17,500 level, but it struggled near the $18,000 resistance zone. The 50% Fib retracement level of the main decline from the $20,670 swing high to $15,555 low also acted as a strong resistance.
It is now trading below $18,500 and the 100 hourly simple moving average. On the upside, an immediate resistance is near the $17,400 level. The first major resistance is near the $18,000 level.
Source: BTCUSD on TradingView.com
A clear move above the $18,000 resistance might push the price further higher. The next major resistance is near $18,500 or the 100 hourly simple moving average, above which the price could test the $20,000 zone.
If bitcoin fails to start a recovery wave above the $18,500 resistance zone, it could continue to move down. An immediate support on the downside is near the $16,900 level and the trend line.
The next major support is near the $16,750 zone. A clear move below the $16,750 support might push the price further lower. In this case, the price may perhaps decline towards the $16,000 support zone.
Technical indicators:
Hourly MACD – The MACD is now gaining pace in the bearish zone.
Hourly RSI (Relative Strength Index) – The RSI for BTC/USD is now below the 50 level.
Major Support Levels – $16,900, followed by $16,750.
Major Resistance Levels – $17,400, $18,000 and $18,500.
Bitcoin price recovered over $1,500 and climbed above $17,500. BTC failed to clear the $18,000 resistance and started a fresh decline.
Bitcoin started a recovery wave above the $17,000 and $17,200 resistance levels.
The price is trading below $18,500 and the 100 hourly simple moving average.
There is a key bullish trend line forming with support near $16,900 on the hourly chart of the BTC/USD pair (data feed from Kraken).
The pair could resume its decline if there is a close below the $16,750 support zone.
Bitcoin price declined heavily below the $18,000 support zone. FTX’s fall is still hurting the market and there was a strong decline towards the $16,000 support zone.
The price traded as low as $15,555 and recently started an upside correction, similar to ethereum, bnb, and ripple. There was a steady recovery wave above the $16,500 and $17,000 resistance levels. The price climbed above the 23.6% Fib retracement level of the main decline from the $20,670 swing high to $15,555 low. There is also a key bullish trend line forming with support near $16,900 on the hourly chart of the BTC/USD pair.
Bitcoin price also moved above the $17,500 level, but it struggled near the $18,000 resistance zone. The 50% Fib retracement level of the main decline from the $20,670 swing high to $15,555 low also acted as a strong resistance.
It is now trading below $18,500 and the 100 hourly simple moving average. On the upside, an immediate resistance is near the $17,400 level. The first major resistance is near the $18,000 level.
Source: BTCUSD on TradingView.com
A clear move above the $18,000 resistance might push the price further higher. The next major resistance is near $18,500 or the 100 hourly simple moving average, above which the price could test the $20,000 zone.
If bitcoin fails to start a recovery wave above the $18,500 resistance zone, it could continue to move down. An immediate support on the downside is near the $16,900 level and the trend line.
The next major support is near the $16,750 zone. A clear move below the $16,750 support might push the price further lower. In this case, the price may perhaps decline towards the $16,000 support zone.
Technical indicators:
Hourly MACD – The MACD is now gaining pace in the bearish zone.
Hourly RSI (Relative Strength Index) – The RSI for BTC/USD is now below the 50 level.
Major Support Levels – $16,900, followed by $16,750.
Major Resistance Levels – $17,400, $18,000 and $18,500.
NewsBTCRead More
TL;DR: PowerCompute mined 8.1 BTC in September, up 37% from a year earlier. Its month-end…
TL;DR: Strategy will report third-quarter 2026 results after US markets close on October 29 and…
TL;DR: US spot Bitcoin ETFs recorded $484.9 million in net outflows on October 7, according…
The research firm sees tokenized stocks, bonds and loans creating new markets for trading and…
Bitcoin Magazine WhiteBIT Integrates Lightning Network for Fast and Cheap Bitcoin Transactions The Lightning Network…
Bitcoin Magazine AI Coding Agents Drive Surge in Bitcoin Integration Requests: Breez Bitcoin software company…