Bitcoin price gained bullish momentum above the $16,500 resistance. BTC could rise further if there is a close above the $17,000 resistance.
Bitcoin started a decent increase above the $16,500 and $16,650 resistance levels.
The price is trading above $16,500 and the 100 hourly simple moving average.
There was a break above a major bearish trend line with resistance near $16,450 on the hourly chart of the BTC/USD pair (data feed from Kraken).
The pair could rise further if there is a close above the $17,000 resistance.
Bitcoin price formed a base above the $16,200 support zone. BTC started a steady increase and was able to clear the $16,500 resistance zone and the 100 hourly simple moving average.
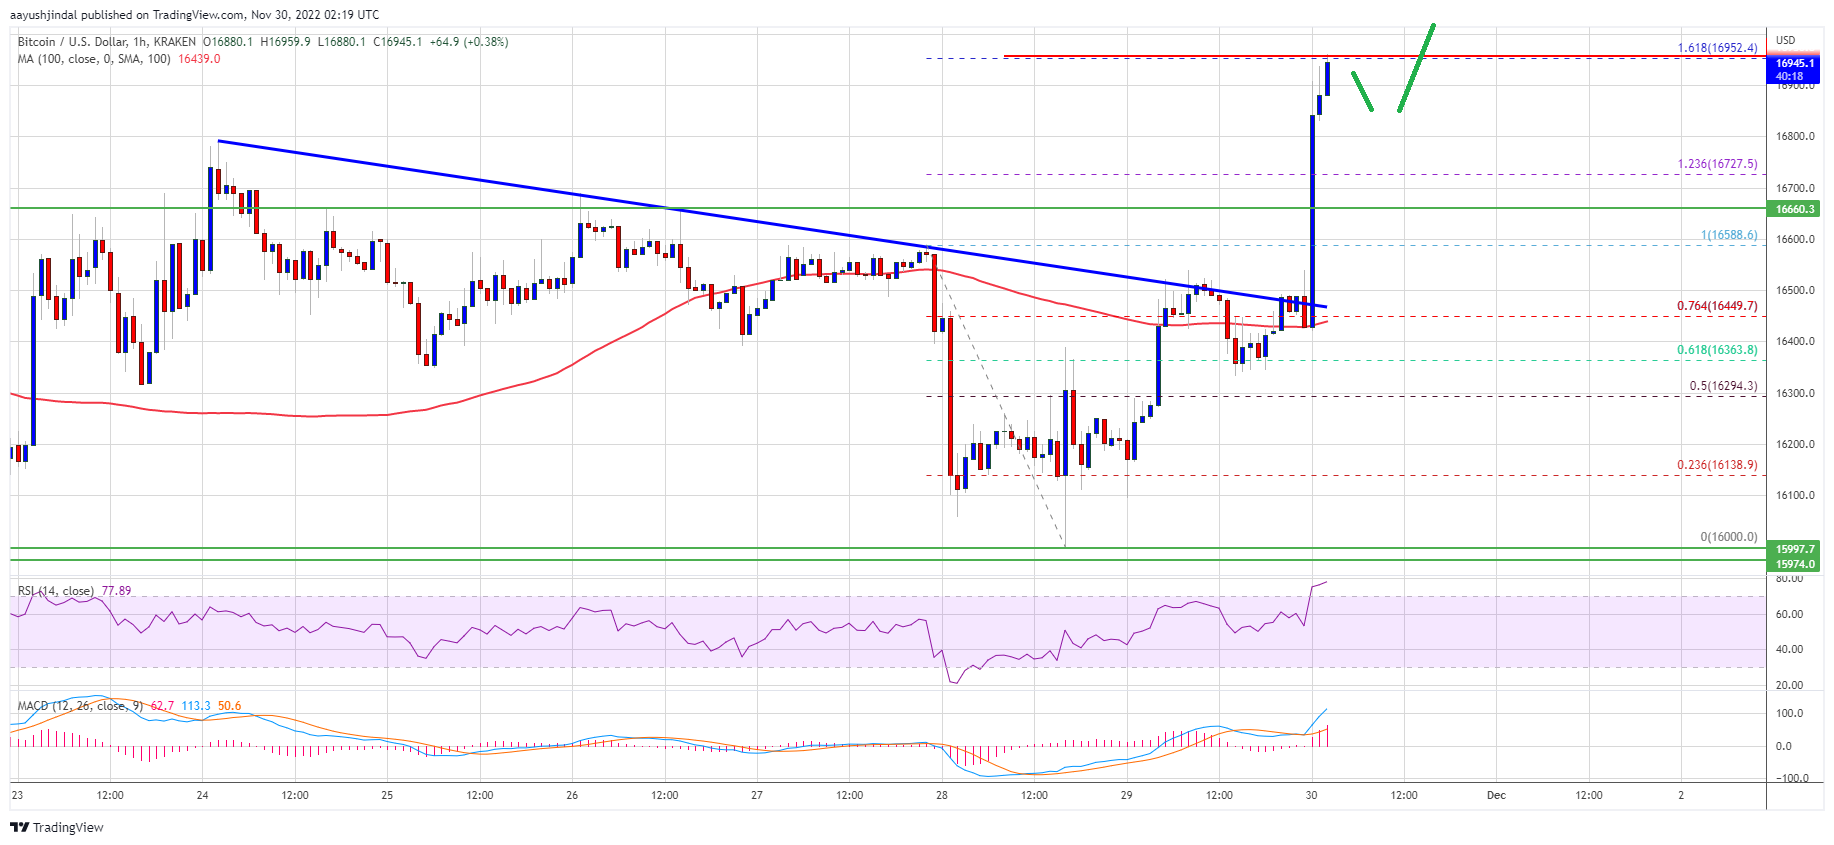
During the increase, there was a break above a major bearish trend line with resistance near $16,450 on the hourly chart of the BTC/USD pair. The pair even surpassed the 76.4% Fib retracement level of the downward move from the $16,589 swing high to $16,000 low.
Bitcoin price is now trading above $16,500 and the 100 hourly simple moving average. It is testing the 1.618 Fib extension level of the downward move from the $16,589 swing high to $16,000 low.
Source: BTCUSD on TradingView.com
On the upside, an immediate resistance is near the $16,950 level. The first major resistance is near the $17,000 zone, above which the price may perhaps accelerate higher. In the stated case, the price could test the $17,500 resistance. The next major resistance is near $18,000, above which the price could gain pace for a move towards the $18,800 zone.
If bitcoin fails to climb above the $17,000 resistance, there could be a downside correction. An immediate support on the downside is near the $16,800 level.
The next major support is near the $16,500 zone or the 100 hourly SMA, below which the price decline further. In the stated case, the price might drop towards the $16,200 support zone. Any more losses might call for a test of the key $16,000 support zone in the near term.
Technical indicators:
Hourly MACD – The MACD is now gaining pace in the bullish zone.
Hourly RSI (Relative Strength Index) – The RSI for BTC/USD is now above the 50 level.
Major Support Levels – $16,800, followed by $16,500.
Major Resistance Levels – $16,950, $17,000 and $17,500.
Bitcoin price gained bullish momentum above the $16,500 resistance. BTC could rise further if there is a close above the $17,000 resistance.
Bitcoin started a decent increase above the $16,500 and $16,650 resistance levels.
The price is trading above $16,500 and the 100 hourly simple moving average.
There was a break above a major bearish trend line with resistance near $16,450 on the hourly chart of the BTC/USD pair (data feed from Kraken).
The pair could rise further if there is a close above the $17,000 resistance.
Bitcoin price formed a base above the $16,200 support zone. BTC started a steady increase and was able to clear the $16,500 resistance zone and the 100 hourly simple moving average.
During the increase, there was a break above a major bearish trend line with resistance near $16,450 on the hourly chart of the BTC/USD pair. The pair even surpassed the 76.4% Fib retracement level of the downward move from the $16,589 swing high to $16,000 low.
Bitcoin price is now trading above $16,500 and the 100 hourly simple moving average. It is testing the 1.618 Fib extension level of the downward move from the $16,589 swing high to $16,000 low.
Source: BTCUSD on TradingView.com
On the upside, an immediate resistance is near the $16,950 level. The first major resistance is near the $17,000 zone, above which the price may perhaps accelerate higher. In the stated case, the price could test the $17,500 resistance. The next major resistance is near $18,000, above which the price could gain pace for a move towards the $18,800 zone.
If bitcoin fails to climb above the $17,000 resistance, there could be a downside correction. An immediate support on the downside is near the $16,800 level.
The next major support is near the $16,500 zone or the 100 hourly SMA, below which the price decline further. In the stated case, the price might drop towards the $16,200 support zone. Any more losses might call for a test of the key $16,000 support zone in the near term.
Technical indicators:
Hourly MACD – The MACD is now gaining pace in the bullish zone.
Hourly RSI (Relative Strength Index) – The RSI for BTC/USD is now above the 50 level.
Major Support Levels – $16,800, followed by $16,500.
Major Resistance Levels – $16,950, $17,000 and $17,500.
Tags: bitcoinbitcoin pricebtcusdBTCUSDTxbtusd
NewsBTCRead More
Crypto analyst Ardi has pointed to a bear market divergence to explain what has been…
Bitcoin is hovering near the $71,000 mark, consolidating after recent swings as the market digests…
First-quarter purchases have reached 89,618 BTC so far, the most since fourth-quarter 2024, and the…
Bitcoin (BTC) is showing early signs of a prolonged decline after peaking in October 2025.…
According to a recent on-chain data evaluation, the Bitcoin price might not be seeing a…
The Bitcoin market remains subject to high uncertainty, with bearish sentiments at heightened levels. In…