Bitcoin price is recovering and trading above $29,000. BTC is slowly moving higher and the bulls might soon aim for a move toward the $30,000 resistance.
Bitcoin is attempting a recovery wave above the $28,800 resistance zone.
The price is trading above $28,800 and the 100 hourly Simple moving average.
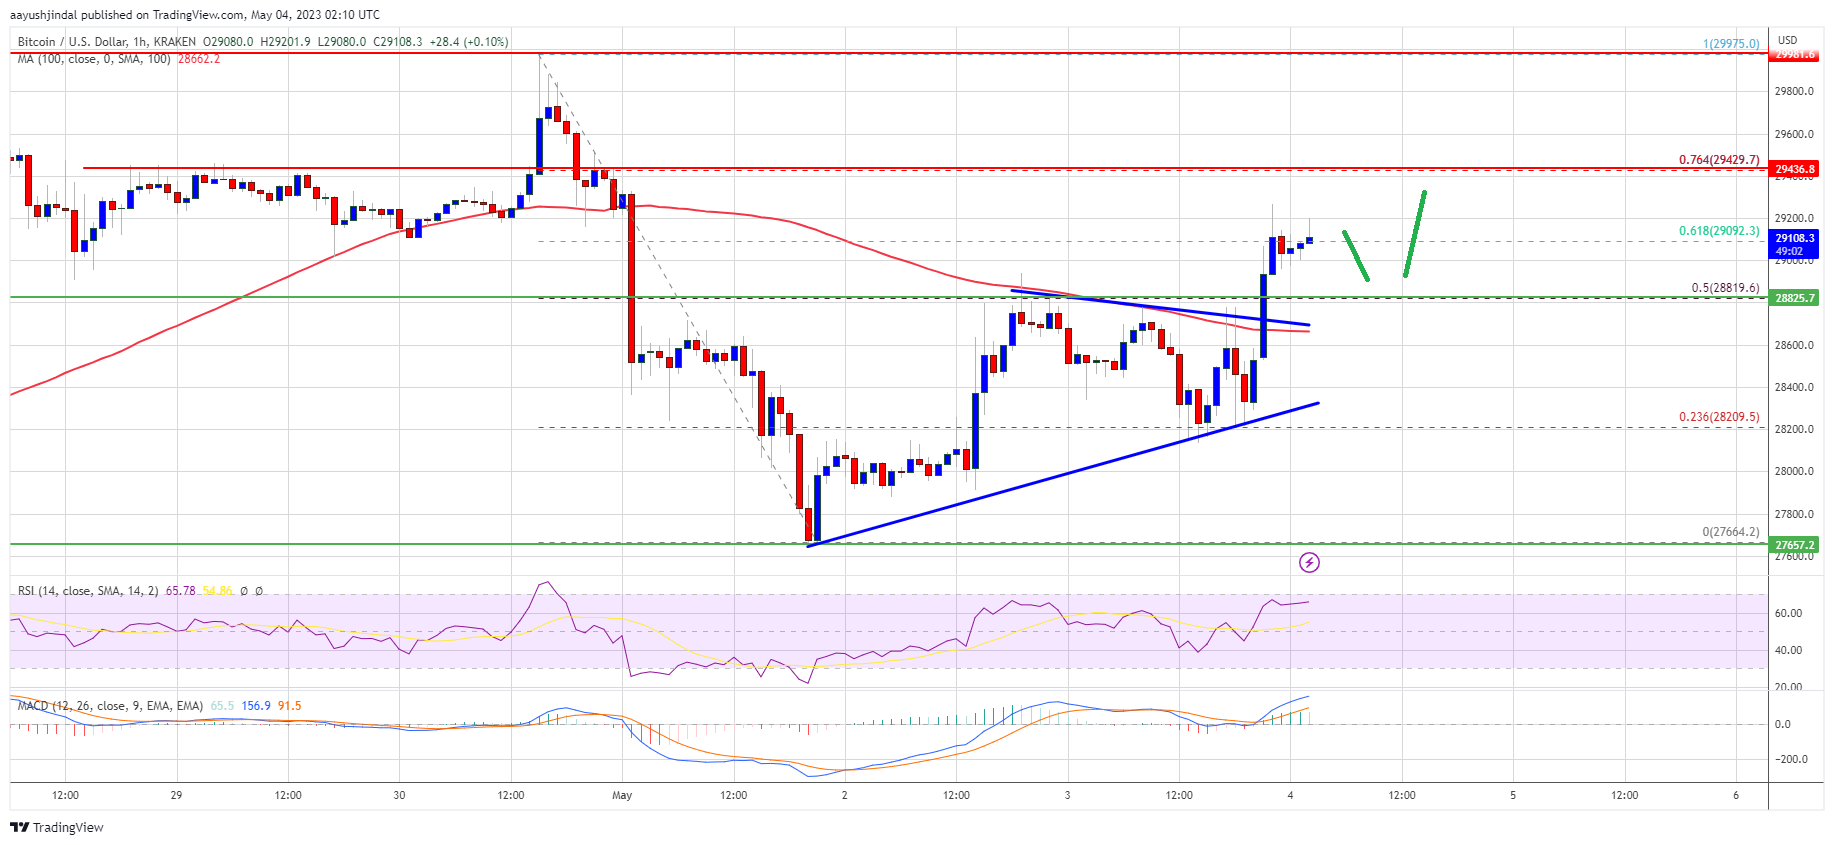
There was a break above a key contracting triangle with resistance near $28,700 on the hourly chart of the BTC/USD pair (data feed from Kraken).
The pair could rise further and revisit the $30,000 resistance zone.
Bitcoin price remained well-bid above the $28,000 support zone. BTC started a decent recovery wave above the $28,500 resistance zone. It even broke the $28,800 resistance after the Fed announced another rate hike from 5% to 5.25%.
There was a break above a key contracting triangle with resistance near $28,700 on the hourly chart of the BTC/USD pair. The pair is now trading above $28,800 and the 100 hourly Simple moving average.
Bitcoin price is currently consolidating near the 61.8% Fib retracement level of the main decline from the $29,975 swing high to the $27,664 low. Immediate resistance is near the $29,200 level.
The next major resistance sits near the $29,420 zone. It is close to the 76.4% Fib retracement level of the main decline from the $29,975 swing high to the $27,664 low. A proper move above the $29,420 resistance zone might send the price toward the $30,000 resistance zone.
Source: BTCUSD on TradingView.com
Any more gains could open the doors for a test of the $30,500 resistance. In the stated case, the price may perhaps rise toward the $31,200 level.
If Bitcoin’s price fails to clear the $29,200 resistance, it could start a downside correction. Immediate support on the downside is near the $28,800 level and the triangle trend line.
The next major support is near the $28,650 zone or the 100 hourly Simple moving average, below which the price might drop toward the $28,400 support zone. Any more losses might take Bitcoin toward the $28,000 level in the near term.
Technical indicators:
Hourly MACD – The MACD is now gaining pace in the bullish zone.
Hourly RSI (Relative Strength Index) – The RSI for BTC/USD is now above the 50 level.
Major Support Levels – $28,800, followed by $28,650.
Major Resistance Levels – $29,200, $29,420, and $30,000.
[#item_full_content]NewsBTCRead MoreDespite stabilizing spot prices, investors remain defensive, with leveraged speculation cooling and realized volatility dropping…
Crypto analyst Ardi has pointed to a bear market divergence to explain what has been…
Bitcoin is hovering near the $71,000 mark, consolidating after recent swings as the market digests…
First-quarter purchases have reached 89,618 BTC so far, the most since fourth-quarter 2024, and the…
Bitcoin (BTC) is showing early signs of a prolonged decline after peaking in October 2025.…
According to a recent on-chain data evaluation, the Bitcoin price might not be seeing a…