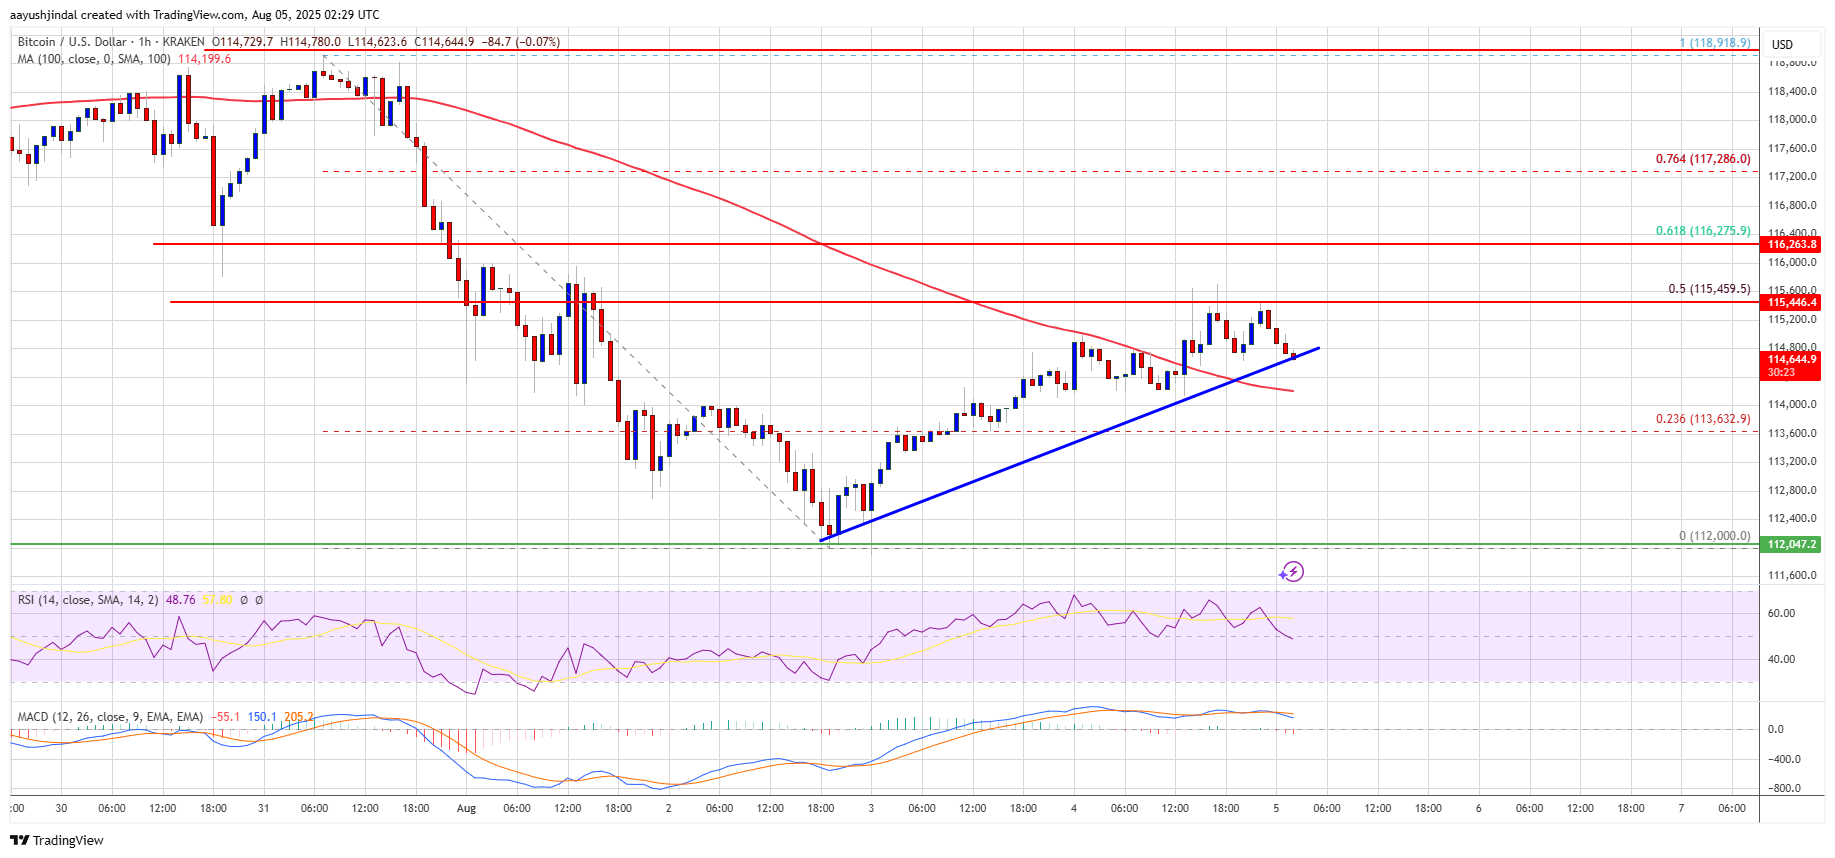
Bitcoin price is recovering from the $112,000 support zone. BTC is rising and might attempt to clear the $115,500 resistance zone to gain bullish momentum.
Bitcoin started a decent upward move from the $112,000 zone.
The price is trading above $114,000 and the 100 hourly Simple moving average.
There is a bullish trend line forming with support at $114,600 on the hourly chart of the BTC/USD pair (data feed from Kraken).
The pair might start another increase if it clears the $115,500 resistance zone.
Bitcoin price started a downward move from the $118,000 zone. BTC declined below the $115,000 and $113,500 support levels to enter a short-term bearish zone.
The price tested the $112,000 zone. A base was formed and the price is now attempting to recover. There was a move above the $113,500 and $114,200 levels. The price surpassed the 23.6% Fib retracement level of the downward move from the $118,918 swing high to the $112,000 low.
Bitcoin is now trading above $114,200 and the 100 hourly Simple moving average. There is also a bullish trend line forming with support at $114,600 on the hourly chart of the BTC/USD pair.
Immediate resistance on the upside is near the $115,500 level. It is close to the 50% Fib retracement level of the downward move from the $118,918 swing high to the $112,000 low. The first key resistance is near the $116,250 level. The next resistance could be $116,800. A close above the $116,800 resistance might send the price further higher. In the stated case, the price could rise and test the $118,500 resistance level. Any more gains might send the price toward the $120,500 level. The main target could be $121,200.
If Bitcoin fails to rise above the $115,500 resistance zone, it could start another decline. Immediate support is near the $114,600 level. The first major support is near the $113,500 level.
The next support is now near the $112,000 zone. Any more losses might send the price toward the $110,500 support in the near term. The main support sits at $108,500, below which BTC might continue to move down.
Technical indicators:
Hourly MACD – The MACD is now gaining pace in the bullish zone.
Hourly RSI (Relative Strength Index) – The RSI for BTC/USD is now above the 50 level.
Major Support Levels – $114,600, followed by $113,500.
Major Resistance Levels – $115,500 and $116,800.
[#item_full_content]NewsBTCRead MoreYour day-ahead look for Aug. 31, 2026Read MoreCoinDesk: Bitcoin, Ethereum, Crypto News and Price Data[#item_full_content]
Bitcoin held near the $78,000 area as geopolitical tension around the Strait of Hormuz pushed…
Bitcoin held steady despite a broader risk-off move after the first U.S. strikes against Iran…
Dan Loeb’s Third Point has disclosed an equity position in Core Scientific, adding another institutional…
The split was mutual, with both parties citing differing views on the future of Bitcoin…
Bitcoin is holding just under $78,000 as August closes. The dollar strength that pushed the…