Bitcoin price is gaining pace above the $42,500 resistance. BTC is showing positive signs and might extend its increase toward the $45,000 resistance.
Bitcoin price is moving higher above the $42,500 resistance zone.
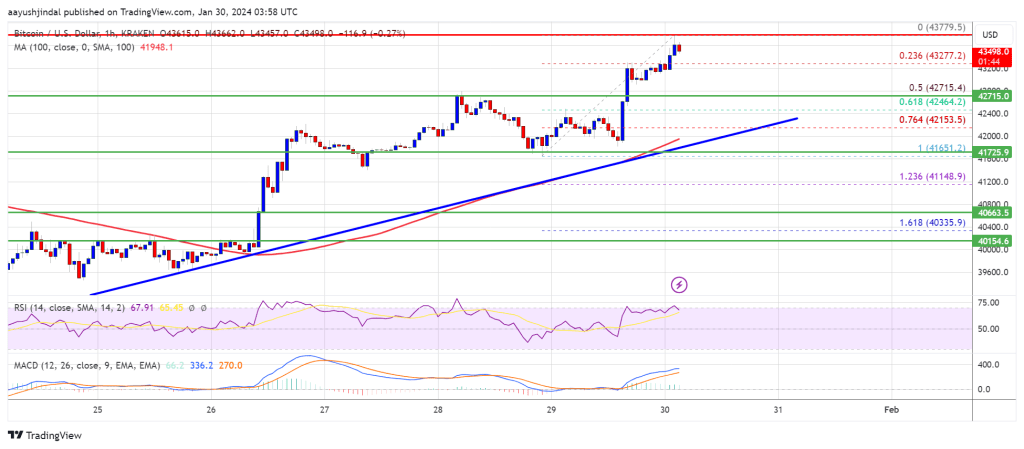
The price is trading above $43,000 and the 100 hourly Simple moving average.
There is a major bullish trend line forming with support near $42,150 on the hourly chart of the BTC/USD pair (data feed from Kraken).
The pair could continue to rise if it clears the $43,800 and $44,200 resistance levels.
Bitcoin price started a decent increase above the $41,200 resistance zone. BTC was able to clear the $42,500 and $42,800 resistance levels to move further into a positive zone.
The bulls pushed the price above the $43,000 resistance and the price pumped toward $43,800. A new weekly high is formed near $43,779 and the price is now consolidating gains. It is trading above the 23.6% Fib retracement level of the upward move from the $41,651 swing low to the $43,779 high.
Bitcoin is now trading above $43,000 and the 100 hourly Simple moving average. There is also a major bullish trend line forming with support near $42,150 on the hourly chart of the BTC/USD pair. The trend line is near the 76.4% Fib retracement level of the upward move from the $41,651 swing low to the $43,779 high.
Immediate resistance is near the $43,800 level. The next key resistance could be $44,200, above which the price could rise and test $44,500. A clear move above the $44,500 resistance could send the price toward the $45,000 resistance.
Source: BTCUSD on TradingView.com
The next resistance is now forming near the $45,500 level. A close above the $45,500 level could push the price further higher. The next major resistance sits at $46,500.
If Bitcoin fails to rise above the $43,800 resistance zone, it could start a downside correction. Immediate support on the downside is near the $43,200 level.
The next major support is $42,500. The main support could be $42,200 and the trend line. If there is a close below $42,200, the price could gain bearish momentum. In the stated case, the price could dive toward the $40,650 support.
Technical indicators:
Hourly MACD – The MACD is now gaining pace in the bullish zone.
Hourly RSI (Relative Strength Index) – The RSI for BTC/USD is now above the 50 level.
Major Support Levels – $43,200, followed by $42,500.
Major Resistance Levels – $43,800, $44,500, and $45,000.
[#item_full_content]NewsBTCRead MoreBTC holds near $70,000 and outperforms major assets during Middle East tensions, even as derivatives…
Two Prime CEO Alexander Blume says the high yield product driving the buying surge carries…
Your day-ahead look for March 12, 2026Read MoreCoinDesk: Bitcoin, Ethereum, Crypto News and Price Data[#item_full_content]
The futures-to-spot ratio has climbed to 5.1, reflecting a structural shift in how the market…
Bitcoin traded around $69,800 as open interest rose to $102 billion, suggesting defensive, bearish bets…
Bitcoin (BTC) is currently navigating a trading range between $60,000 and $73,000, entering what analytics…