Bitcoin price started a fresh increase above the $37,000 resistance zone. BTC could accelerate higher once there is a clear move above the $37,350 resistance.
Bitcoin started a fresh increase from the $35,500 support zone.
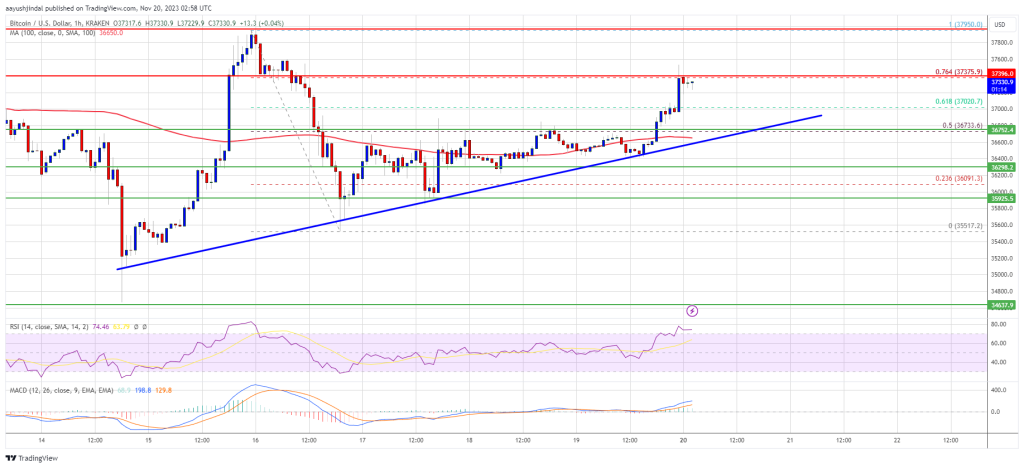
The price is trading above $36,700 and the 100 hourly Simple moving average.
There is a key bullish trend line forming with support near $36,720 on the hourly chart of the BTC/USD pair (data feed from Kraken).
The pair could continue to move up toward $40,000 if it clears $37,350 and $38,000.
Bitcoin price found support near the $35,500 zone after a steady decline. BTC bulls were active above the $35,500 level and were able to start a fresh increase.
There was a move above the $36,500 and $37,000 resistance levels. The price climbed above the 50% Fib retracement level of the downward wave from the $37,950 swing high to the $35,518 low. The price even spiked above $37,200.
Bitcoin is now trading above $36,700 and the 100 hourly Simple moving average. There is also a key bullish trend line forming with support near $36,720 on the hourly chart of the BTC/USD pair.
On the upside, immediate resistance is near the $37,350 level. It is near the 76.4% Fib retracement level of the downward wave from the $37,950 swing high to the $35,518 low. A clear move above the $37,350 resistance might send the price toward the $37,800 level.
Source: BTCUSD on TradingView.com
The next key resistance could be near $38,000. A close above the $38,000 resistance could start a strong increase. The first major resistance is near $39,200, above which the price might accelerate further higher. In the stated case, it could test the $40,000 level. Any more gains might send BTC toward the $42,000 level.
If Bitcoin fails to rise above the $37,350 resistance zone, it could start another decline. Immediate support on the downside is near the $37,000 level.
The next major support is $36,700 and the trend line. If there is a move below $36,700, there is a risk of more downsides. In the stated case, the price could drop toward the $35,950 support in the near term. The next key support or target could be $35,500.
Technical indicators:
Hourly MACD – The MACD is now losing pace in the bullish zone.
Hourly RSI (Relative Strength Index) – The RSI for BTC/USD is now above the 50 level.
Major Support Levels – $37,000, followed by $36,700.
Major Resistance Levels – $37,350, $37,800, and $38,000.
[#item_full_content]NewsBTCRead MoreYour day-ahead look for Feb. 11, 2026Read MoreCoinDesk: Bitcoin, Ethereum, Crypto News and Price Data[#item_full_content]
Michael Saylor, the outspoken Bitcoin (BTC) advocate and Strategy (previously MicroStrategy) co-founder, said on Tuesday…
What to Know: Bitcoin whales have added over $4.7B in $BTC, signaling deep conviction despite…
What to Know: Bitcoin’s rebound attempts are still flow-driven; recent US spot Bitcoin ETF data…
During an interview at Consensus Hong Kong 2026, Joseph Lubin argued that "blue chip" decentralized…
Bitcoin and ether extended declines, dragging down crypto-related stocks, even as gold and silver rallied.Read…