Bitcoin price extended gains above the $68,000 resistance level. BTC bulls seem to be in action, and they might aim for a move toward the $70,000 level.
Bitcoin started a fresh increase above the $66,500 resistance zone.
The price is trading above $66,500 and the 100 hourly Simple moving average.
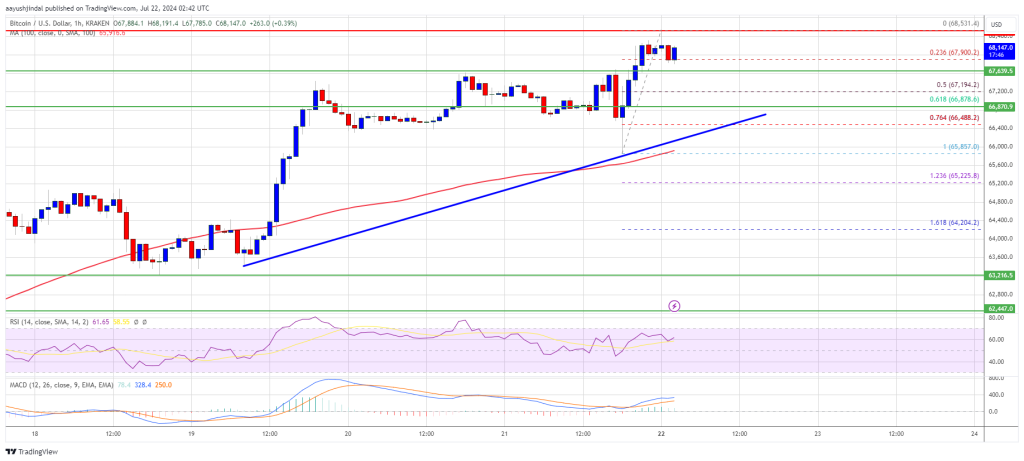
There is a connecting bullish trend line forming with support at $66,500 on the hourly chart of the BTC/USD pair (data feed from Kraken).
The pair might extend gains and trade above the $68,800 resistance zone.
Bitcoin price remained well-supported above the $65,500 and $66,000 resistance levels. BTC started a fresh increase and was able to clear the $66,500 resistance.
There was a clear move above the $67,200 level and the price even climbed above $68,000. A high was formed at $68,531 and the price is now consolidating gains. There was a move toward the 23.6% Fib retracement level of the upward move from the $65,857 swing low to the $68,531 high.
Bitcoin price is now trading above $66,500 and the 100 hourly Simple moving average. There is also a connecting bullish trend line forming with support at $66,500 on the hourly chart of the BTC/USD pair. The trend line is close to the 61.8% Fib retracement level of the upward move from the $65,857 swing low to the $68,531 high.
If there is a fresh increase, the price could face resistance near the $68,500 level. The first key resistance is near the $68,800 level. A clear move above the $68,800 resistance might spark another increase in the coming sessions.
The next key resistance could be $69,500. The next major hurdle sits at $70,000. A close above the $70,000 resistance might push the price further higher. In the stated case, the price could rise and test the $72,000 resistance.
If Bitcoin fails to climb above the $68,500 resistance zone, it could start a downside correction. Immediate support on the downside is near the $67,600 level.
The first major support is $67,200. The next support is now near $66,500 and the trend line. Any more losses might send the price toward the $65,500 support zone in the near term.
Technical indicators:
Hourly MACD – The MACD is now gaining pace in the bullish zone.
Hourly RSI (Relative Strength Index) – The RSI for BTC/USD is now above the 50 level.
Major Support Levels – $67,200, followed by $66,500.
Major Resistance Levels – $68,500, and $68,800.
[#item_full_content]NewsBTCRead MoreThe securities have financed purchases of nearly 136,000 bitcoin, opening a funding channel that analysts…
Bitcoin has sunk to its weakest level in more than one month.Read MoreCoinDesk: Bitcoin, Ethereum,…
Borrowing against bitcoin and earning income to build their BTC holdings are becoming priorities for…
Bitcoin Magazine Bitcoin Core Ends Long Embargoes for Bugs AI Can Rediscover Bitcoin Core has…
Bitcoin Magazine Bitcoin ETFs Lose Over $635M In One Day Following Oil Price Spike U.S.…
Bitcoin Magazine Franklin Templeton Clears Final Hurdle For ETFs That Turn Stock Dividends Into Bitcoin…