Bitcoin price started a recovery wave above $88,000. BTC is now struggling and might face hurdles near the $89,500 zone and $90,000.
Bitcoin started a recovery wave and climbed toward $89,000.
The price is trading above $86,000 and the 100 hourly Simple moving average.
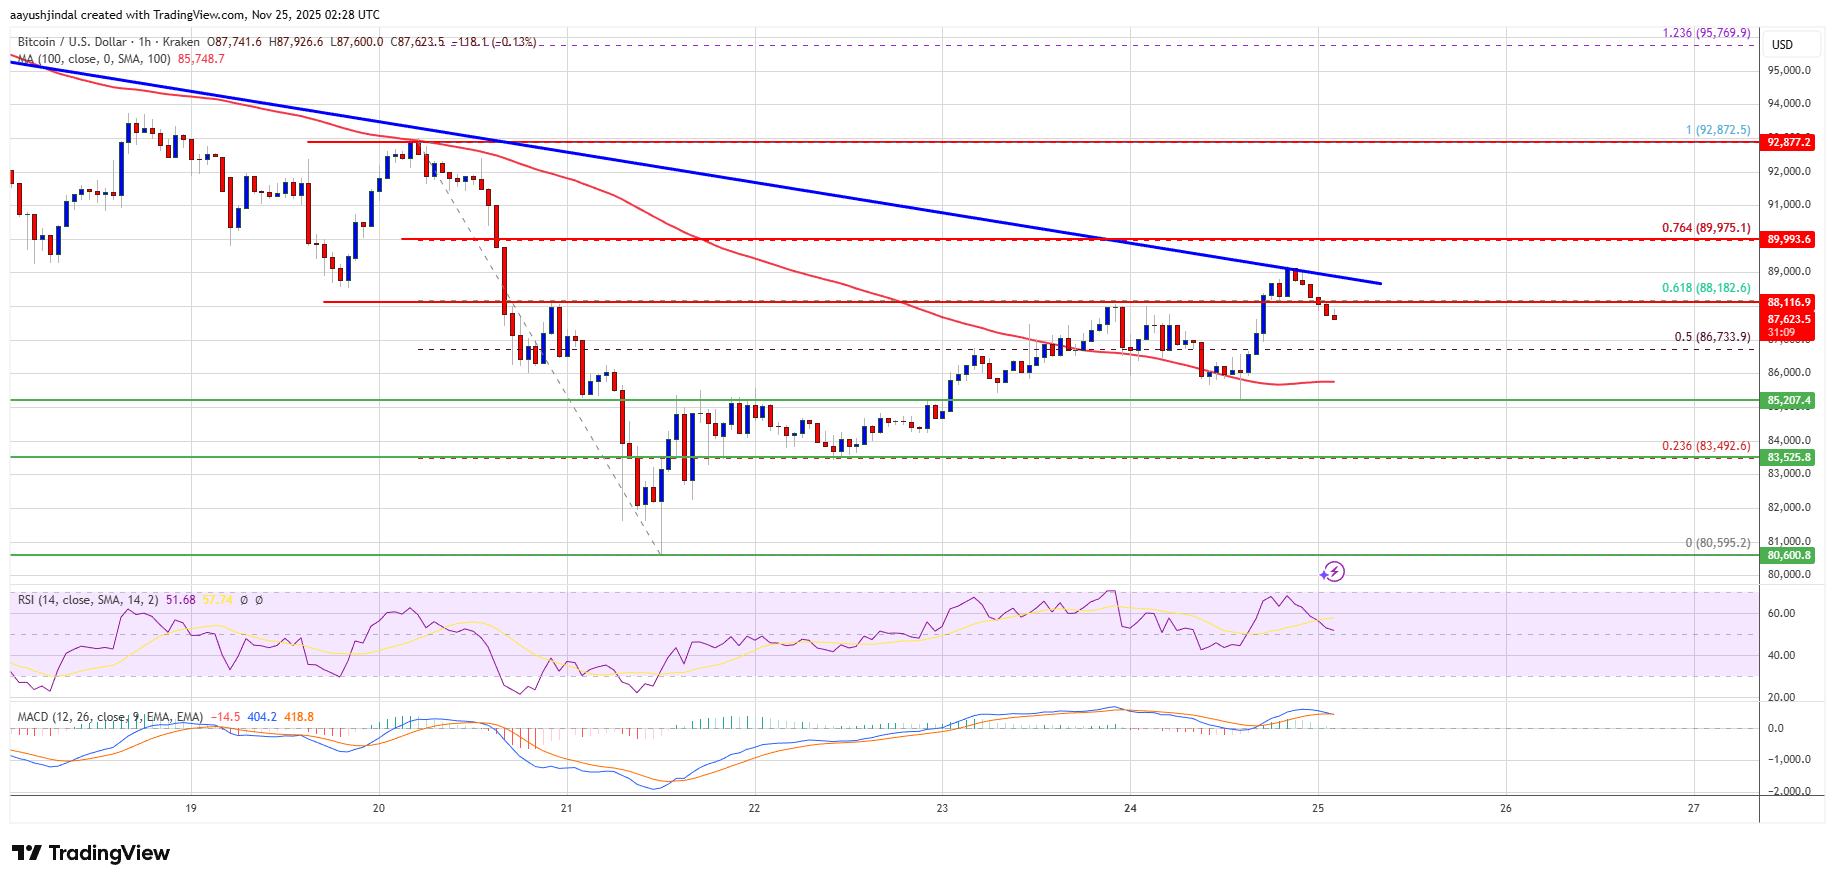
There is a bearish trend line forming with resistance at $89,000 on the hourly chart of the BTC/USD pair (data feed from Kraken).
The pair might continue to move down if it settles below the $86,000 zone.
Bitcoin price managed to stay above the $82,000 level. BTC formed a base and recently started a recovery wave above the $85,000 resistance zone.
There was a move above the $86,500 resistance zone. The bulls pushed the price above the 50% Fib retracement level of the downward move from the $92,872 swing high to the $80,595 low. However, the bears seem to be active below the $90,000 zone.
Besides, there is a bearish trend line forming with resistance at $89,000 on the hourly chart of the BTC/USD pair. Bitcoin is now trading above $87,000 and the 100 hourly Simple moving average.
If the bulls attempt another recovery wave, the price could face resistance near the $88,500 level. The first key resistance is near the $89,000 level and the trend line. The next resistance could be $90,000 or the 76.4% Fib retracement level of the downward move from the $92,872 swing high to the $80,595 low.
A close above the $90,000 resistance might send the price further higher. In the stated case, the price could rise and test the $92,500 resistance. Any more gains might send the price toward the $93,200 level. The next barrier for the bulls could be $94,500 and $95,000.
If Bitcoin fails to rise above the $89,000 resistance zone, it could start another decline. Immediate support is near the $86,750 level. The first major support is near the $86,000 level.
The next support is now near the $83,500 zone. Any more losses might send the price toward the $82,500 support in the near term. The main support sits at $80,000, below which BTC might accelerate lower in the near term.
Technical indicators:
Hourly MACD – The MACD is now losing pace in the bullish zone.
Hourly RSI (Relative Strength Index) – The RSI for BTC/USD is now above the 50 level.
Major Support Levels – $86,000, followed by $83,500.
Major Resistance Levels – $89,000 and $90,000.
[#item_full_content]NewsBTCRead MoreBitcoin Magazine South African Eskom Considering Discount Power for Bitcoin Miners as Solar Creates Surplus…
Surging to a near one-month high of $74,000, bitcoin reversed back to just above $71,000…
The billionaire investor said stablecoins could become the whole payment system in 10-15 years, and…
Wall Street’s biggest gold fund saw something unusual recently — a single-day outflow of $3…
Falling oil prices are helping, but a bounce seemed in the cards after some of…
Bitcoin Magazine Bitcoin Price Reclaims $73,000 as War Shakes Markets, Outperforming Gold and Stocks The…