Bitcoin price found support near the $56,350 zone. BTC is recovering higher, but the bears might be active near the $60,000 resistance zone.
Bitcoin is attempting a recovery wave from the $56,350 support zone.
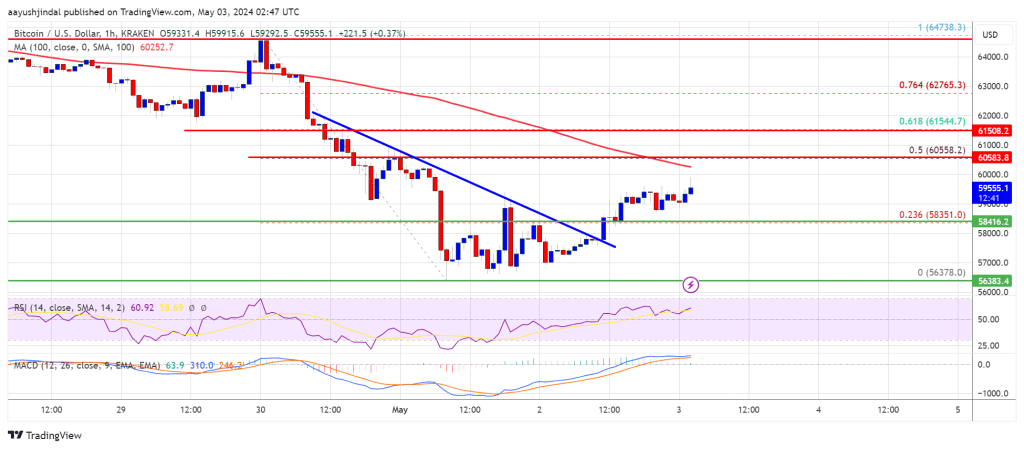
The price is trading below $60,000 and the 100 hourly Simple moving average.
There was a break above a key bearish trend line with resistance at $57,800 on the hourly chart of the BTC/USD pair (data feed from Kraken).
The pair could struggle to clear the $60,000 and $60,500 resistance levels.
Bitcoin price extended losses below the $60,000 level to enter a short-term bearish zone. BTC even traded below the $58,000 level before the bulls appeared near the $56,350 level.
A low was formed at $56,378 and the price started a decent recovery wave. The price climbed above the $58,000 resistance zone. There was a break above a key bearish trend line with resistance at $57,800 on the hourly chart of the BTC/USD pair.
The price climbed above the 23.6% Fib retracement level of the downward wave from the $64,738 swing high to the $56,378 low. Bitcoin is still trading below $60,000 and the 100 hourly Simple moving average.
Immediate resistance is near the $60,000 level. The first major resistance could be $60,500. It is close to the 50% Fib retracement level of the downward wave from the $64,738 swing high to the $56,378 low. The next key resistance could be $61,500.
Source: BTCUSD on TradingView.com
A clear move above the $61,500 resistance might send the price higher. The next resistance now sits at $63,400. If there is a clear move above the $63,400 resistance zone, the price could continue to move up. In the stated case, the price could rise toward $65,000.
If Bitcoin fails to rise above the $60,500 resistance zone, it could start another decline. Immediate support on the downside is near the $58,500 level.
The first major support is $57,800. If there is a close below $57,800, the price could start to drop toward $56,350. Any more losses might send the price toward the $55,000 support zone in the near term.
Technical indicators:
Hourly MACD – The MACD is now losing pace in the bearish zone.
Hourly RSI (Relative Strength Index) – The RSI for BTC/USD is now above the 50 level.
Major Support Levels – $57,000, followed by $56,500.
Major Resistance Levels – $60,000, $60,500, and $61,500.
[#item_full_content]NewsBTCRead MoreBitcoin Magazine Bitcoin ETFs Bled Nearly Half a Billion Dollars End of Last Week, Reversing…
Bitcoin Magazine Strategy Skips Bitcoin Again, Buys Back $25M of STRC Stock Bitcoin treasury Strategy…
The Ethereum treasury company added nearly 10,000 ETH while expanding its stock buyback, citing ether…
The put/call ratio has fallen to about 0.52 from 0.76 in late June, and one-week…
The vast majority of the activity was concentrated in BlackRock’s IBIT product accounting for nearly…
Your day-ahead look for July 27, 2026Read MoreCoinDesk: Bitcoin, Ethereum, Crypto News and Price Data[#item_full_content]