Bitcoin price found support near the $56,350 zone. BTC is recovering higher, but the bears might be active near the $60,000 resistance zone.
Bitcoin is attempting a recovery wave from the $56,350 support zone.
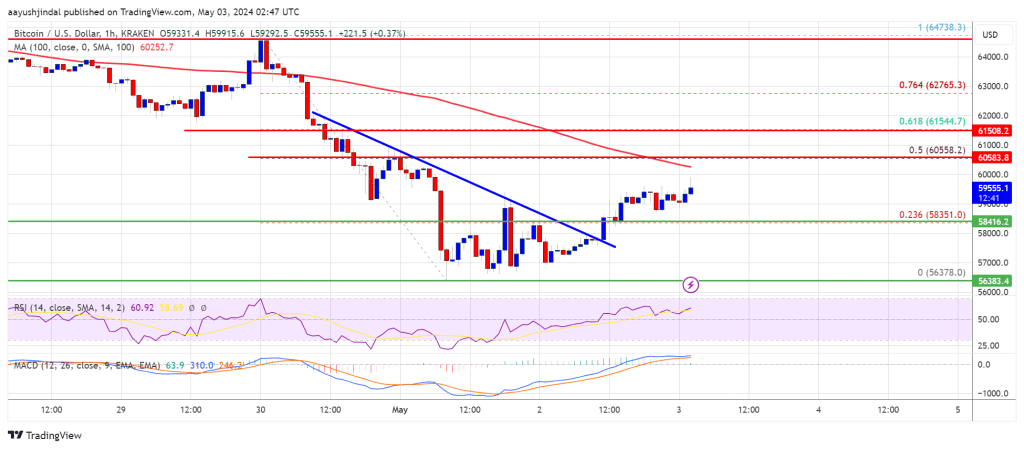
The price is trading below $60,000 and the 100 hourly Simple moving average.
There was a break above a key bearish trend line with resistance at $57,800 on the hourly chart of the BTC/USD pair (data feed from Kraken).
The pair could struggle to clear the $60,000 and $60,500 resistance levels.
Bitcoin price extended losses below the $60,000 level to enter a short-term bearish zone. BTC even traded below the $58,000 level before the bulls appeared near the $56,350 level.
A low was formed at $56,378 and the price started a decent recovery wave. The price climbed above the $58,000 resistance zone. There was a break above a key bearish trend line with resistance at $57,800 on the hourly chart of the BTC/USD pair.
The price climbed above the 23.6% Fib retracement level of the downward wave from the $64,738 swing high to the $56,378 low. Bitcoin is still trading below $60,000 and the 100 hourly Simple moving average.
Immediate resistance is near the $60,000 level. The first major resistance could be $60,500. It is close to the 50% Fib retracement level of the downward wave from the $64,738 swing high to the $56,378 low. The next key resistance could be $61,500.
Source: BTCUSD on TradingView.com
A clear move above the $61,500 resistance might send the price higher. The next resistance now sits at $63,400. If there is a clear move above the $63,400 resistance zone, the price could continue to move up. In the stated case, the price could rise toward $65,000.
If Bitcoin fails to rise above the $60,500 resistance zone, it could start another decline. Immediate support on the downside is near the $58,500 level.
The first major support is $57,800. If there is a close below $57,800, the price could start to drop toward $56,350. Any more losses might send the price toward the $55,000 support zone in the near term.
Technical indicators:
Hourly MACD – The MACD is now losing pace in the bearish zone.
Hourly RSI (Relative Strength Index) – The RSI for BTC/USD is now above the 50 level.
Major Support Levels – $57,000, followed by $56,500.
Major Resistance Levels – $60,000, $60,500, and $61,500.
[#item_full_content]NewsBTCRead MoreBitcoin Magazine David Bailey Confirmed As A Bitcoin 2026 Speaker David Bailey has been officially…
Bitcoin Magazine Paraguay Adopts Stricter Crypto Oversight, Mandates Detailed Transaction on Bitcoin Reporting Paraguay’s National…
Bitcoin Magazine Policy Group Calls for Bitcoin Inclusion in Proposed Crypto Tax Exemption The Bitcoin…
Bitcoin Magazine Corporate Bitcoin Holdings Hit Record High as Institutions Accumulate 2.8x Mining Supply: Report…
Research shows that only 8% to 10% of global Bitcoin hashrate runs in oil-sensitive power…
Today’s quantum computers are far from breaking Bitcoin’s cryptography and any real threat would likely…