Bitcoin price started a downside extension below $92,000. BTC is now recovering from $89,220 and might face barriers for a fresh increase near $92,000.
Bitcoin started a recovery wave above $90,000 and $90,500.
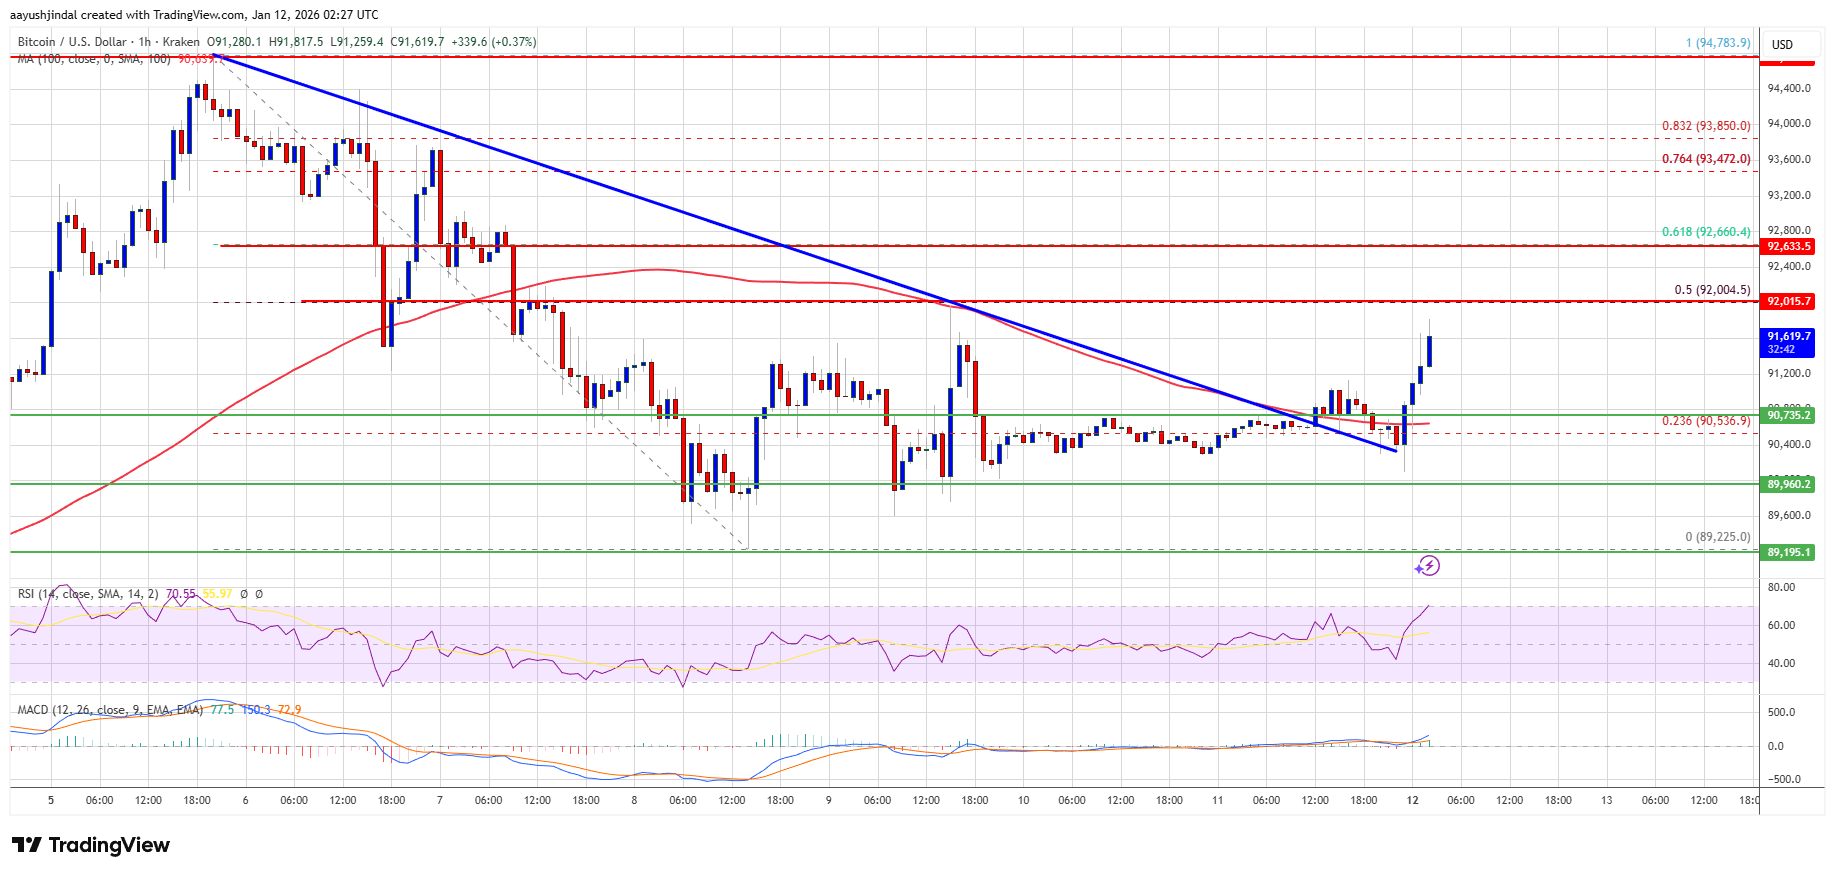
The price is trading above $91,000 and the 100 hourly Simple moving average.
There was a break above a bearish trend line with resistance at $90,750 on the hourly chart of the BTC/USD pair (data feed from Kraken).
The pair might continue to move up if it stays above the $90,000 zone.
Bitcoin price failed to stay above $91,500 and started a downside correction. BTC dipped below $92,000 and $91,200 to enter a short-term bearish zone.
The price even dipped below $90,500 and tested $90,000. A low was formed at $89,225 and the price is now attempting a fresh increase. There was a move above $90,500. The price climbed higher above the 23.6% Fib retracement level of the recent decline from the $93,770 swing high to the $89,225 low.
Besides, there was a break above a bearish trend line with resistance at $90,750 on the hourly chart of the BTC/USD pair. Bitcoin is now trading above $91,000 and the 100 hourly Simple moving average.
If the price remains stable above $90,500, it could attempt a fresh increase. Immediate resistance is near the $92,000 level and the 50% Fib retracement level of the recent decline from the $93,770 swing high to the $89,225 low. The first key resistance is near the $92,650 level.
The next resistance could be $93,500. A close above the $93,500 resistance might send the price further higher. In the stated case, the price could rise and test the $94,000 resistance. Any more gains might send the price toward the $94,500 level. The next barrier for the bulls could be $95,000 and $95,500.
If Bitcoin fails to rise above the $92,500 resistance zone, it could start another decline. Immediate support is near the $91,250 level. The first major support is near the $90,500 level.
The next support is now near the $90,000 zone. Any more losses might send the price toward the $89,250 support in the near term. The main support sits at $88,000, below which BTC might accelerate lower in the near term.
Technical indicators:
Hourly MACD – The MACD is now gaining pace in the bullish zone.
Hourly RSI (Relative Strength Index) – The RSI for BTC/USD is now above the 50 level.
Major Support Levels – $91,250, followed by $90,500.
Major Resistance Levels – $92,500 and $93,500.
[#item_full_content]NewsBTCRead MoreBitcoin is holding up near the upper $60Ks–$70K region despite a sharp macro shock, showing…
Bitcoin Magazine A Record $409M Day Shows How Strategy Is Rapidly Scaling Bitcoin Accumulation With…
Your day-ahead look for March 11, 2026Read MoreCoinDesk: Bitcoin, Ethereum, Crypto News and Price Data[#item_full_content]
BTC traded near $69,500 after failing to hold $71,000 as the Iran war kept markets…
Bitcoin (BTC) is retesting resistance levels as its price recovers the $71,000 mark. However, an…
Seven major central banks, including the Federal Reserve, will issue rate decisions next week just…