Bitcoin price started a recovery wave above $67,500. BTC is now consolidating below $68,800 and might struggle to continue higher.
Bitcoin started a recovery wave above $67,000 and $67,200.
The price is trading above $67,000 and the 100 hourly simple moving average.
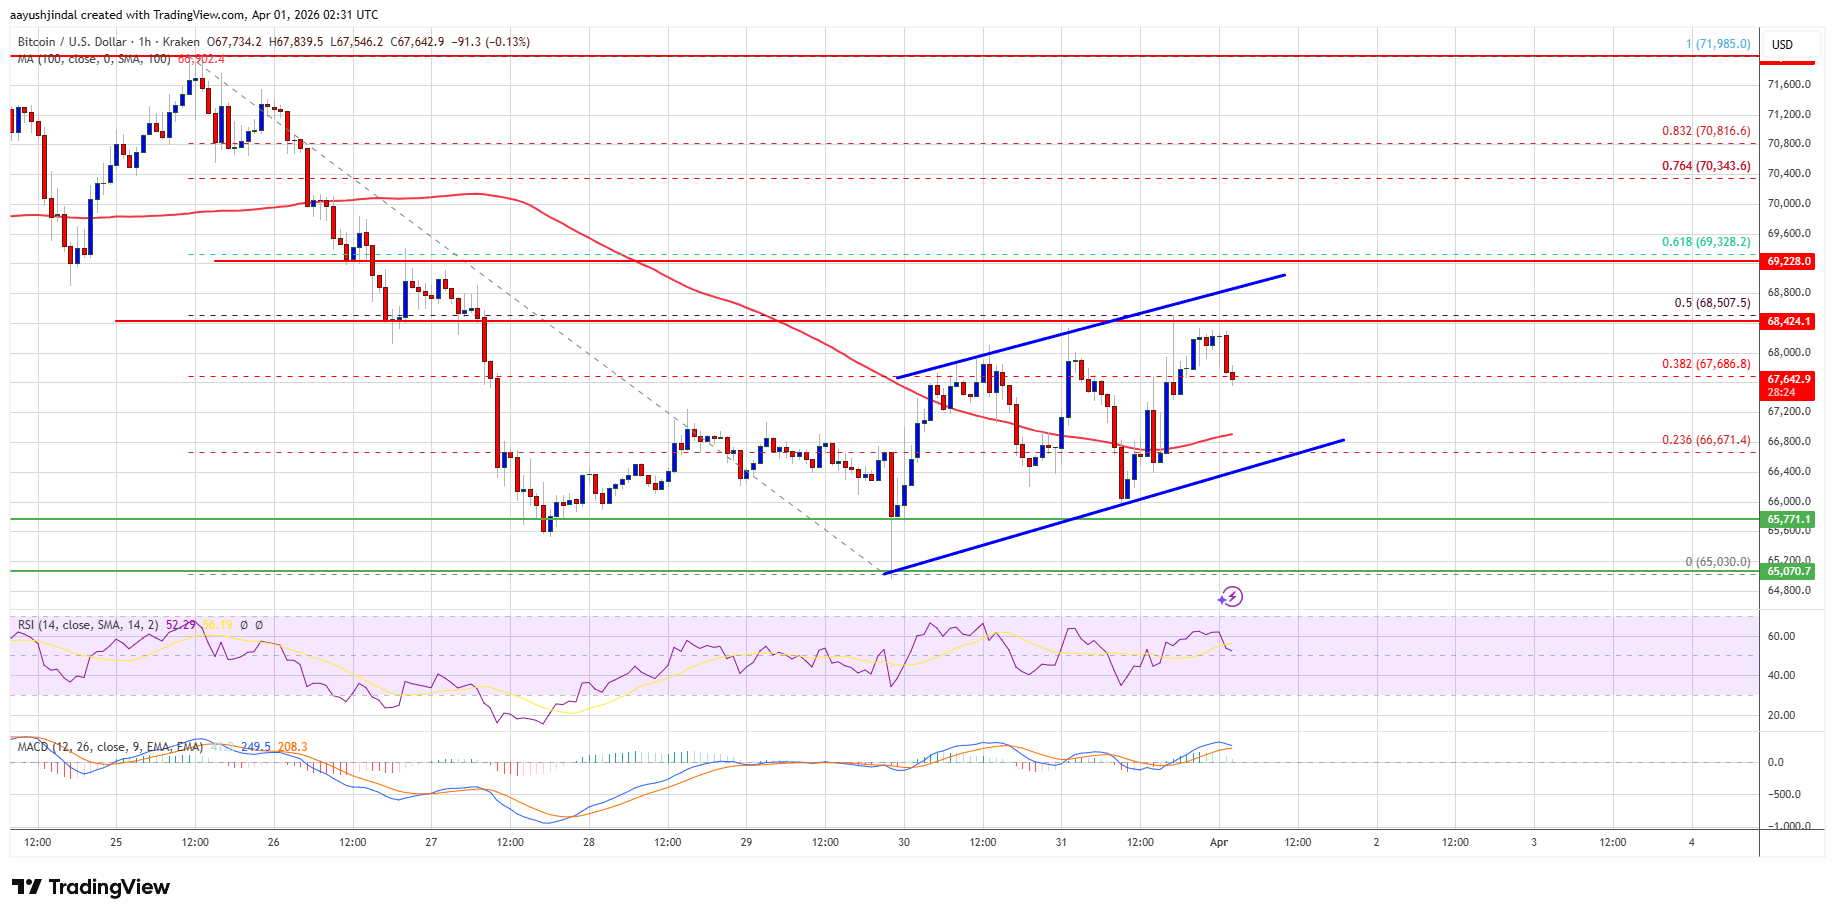
There is a rising channel forming with resistance at $68,800 on the hourly chart of the BTC/USD pair (data feed from Kraken).
The pair might start another decline if it stays below the $68,500 and $68,800 levels.
Bitcoin price formed a base above $65,500 and started a recovery wave. BTC was able to settle above $66,000 to move into a short-term positive zone.
The price climbed above the $67,200 resistance zone. The bulls even cleared the 38.2% Fib retracement level of the downward move from the $71,986 swing high to the $65,030 low. However, the bears are now active near the $68,500 resistance zone.
Bitcoin is now trading above $67,000 and the 100 hourly simple moving average. If the price remains stable above $67,000, it could attempt a fresh increase. Immediate resistance is near the $68,500 level or the 50% Fib retracement level of the downward move from the $71,986 swing high to the $65,030 low.
The first key resistance is near the $68,800 level. There is also a rising channel forming with resistance at $68,800 on the hourly chart of the BTC/USD pair. A close above the $68,800 resistance might send the price further higher. In the stated case, the price could rise and test the $69,250 resistance. Any more gains might send the price toward the $69,500 level. The next barrier for the bulls could be $70,000.
If Bitcoin fails to rise above the $68,800 resistance zone, it could start another decline. Immediate support is near the $67,000 level. The first major support is near the $66,800 level.
The next support is now near the $65,800 zone. Any more losses might send the price toward the $65,800 support in the near term. The main support now sits at $65,000, below which BTC might struggle to recover in the near term.
Technical indicators:
Hourly MACD – The MACD is now losing pace in the bullish zone.
Hourly RSI (Relative Strength Index) – The RSI for BTC/USD is now above the 50 level.
Major Support Levels – $67,000, followed by $65,800.
Major Resistance Levels – $68,500 and $68,800.
[#item_full_content]NewsBTCRead MoreThe gap between bitcoin's spot price and realized price is compressing toward levels that historically…
About 97% of the machines used to mine Bitcoin currently come from companies based in…
A New Hampshire state authority is set to issue a first-of-its-kind bitcoin-backed bond with a…
Bitcoin Magazine New Hampshire’s Bitcoin-Backed Municipal Bond Moves Closer With Moody’s Rating A first-of-its-kind municipal…
With a few hours to go, bitcoin has tumbled 22% in the first quarter, following…
Bitcoin may no longer be moving in lockstep with the S&P 500 over a short…