Bitcoin price found support near the $63,500 zone. BTC is now rising and showing positive signs above the $65,500 resistance zone.
Bitcoin formed a base and started a fresh increase above the $65,000 resistance zone.
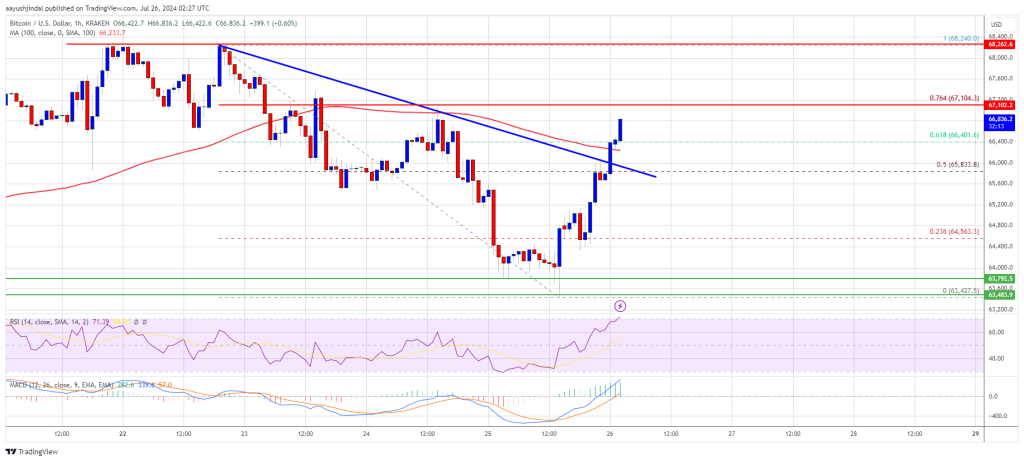
The price is trading above $65,500 and the 100 hourly Simple moving average.
There was a break above a key bearish trend line with resistance at $66,000 on the hourly chart of the BTC/USD pair (data feed from Kraken).
The pair might accelerate higher toward the $67,500 and $68,000 levels in the short term.
Bitcoin price extended losses and traded below the $64,200 level. However, BTC bulls were active near the $63,500 level. A low was formed at $63,427 and the price recently started a fresh increase.
There was a move above the $64,500 and $65,000 resistance levels. The price climbed above the 50% Fib retracement level of the downward move from the $68,240 swing high to the $63,427 low. Besides, there was a break above a key bearish trend line with resistance at $66,000 on the hourly chart of the BTC/USD pair.
Bitcoin price is now trading above $65,500 and the 100 hourly Simple moving average. If the price continues to rise, it could face resistance near the $67,000 level or the 76.4% Fib retracement level of the downward move from the $68,240 swing high to the $63,427 low.
The first key resistance is near the $67,500 level. A clear move above the $67,500 resistance might send the price further higher in the coming sessions. The next key resistance could be $68,000. The next major hurdle sits at $68,500. A close above the $68,500 resistance might spark bullish moves. In the stated case, the price could rise and test the $70,000 resistance.
If Bitcoin fails to recover above the $67,000 resistance zone, it could start another decline. Immediate support on the downside is near the $66,400 level and the 100 hourly Simple moving average.
The first major support is $65,500. The next support is now near $65,000. Any more losses might send the price toward the $63,500 support zone in the near term.
Technical indicators:
Hourly MACD – The MACD is now gaining pace in the bullish zone.
Hourly RSI (Relative Strength Index) – The RSI for BTC/USD is now above the 50 level.
Major Support Levels – $66,400, followed by $65,500.
Major Resistance Levels – $67,000, and $68,000.
[#item_full_content]NewsBTCRead MoreThe company sold 3,588 bitcoin last week to replenish its dollar reserves for dividends on…
Bitcoin Magazine Strategy (MSTR) Sells 3,588 Bitcoin to Cover Preferred Dividends Strategy sold 3,588 bitcoin…
Bitcoin Magazine Strive (ASST) Adds 17.76 Bitcoin as Falling Prices Boost Its Quarterly Yield Strive,…
Your day-ahead look for July 6, 2026Read MoreCoinDesk: Bitcoin, Ethereum, Crypto News and Price Data[#item_full_content]
A reading that negative means investors would have been better off in risk-free assets like…
Bitcoin touched $63,882 overnight before retreating to around $62,900, per CoinDesk data. Sunday's high held…