Bitcoin price found support near the $63,500 zone. BTC is now rising and showing positive signs above the $65,500 resistance zone.
Bitcoin formed a base and started a fresh increase above the $65,000 resistance zone.
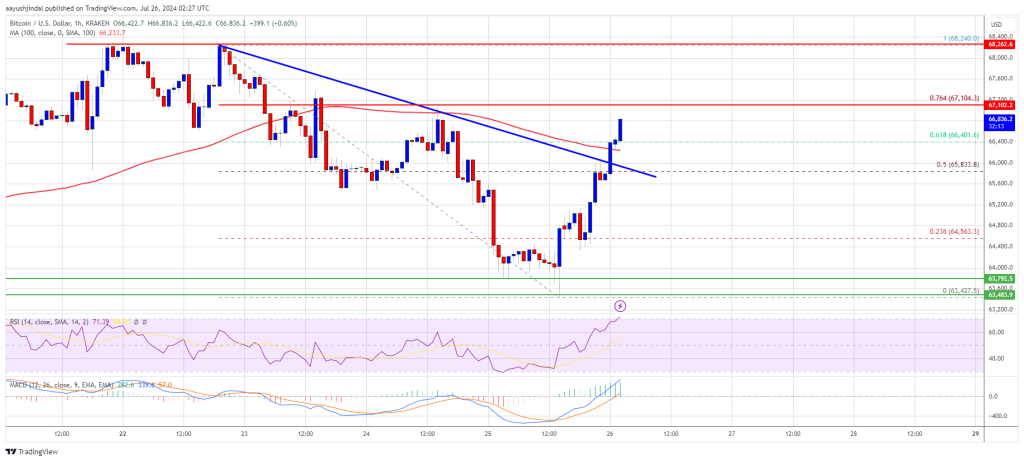
The price is trading above $65,500 and the 100 hourly Simple moving average.
There was a break above a key bearish trend line with resistance at $66,000 on the hourly chart of the BTC/USD pair (data feed from Kraken).
The pair might accelerate higher toward the $67,500 and $68,000 levels in the short term.
Bitcoin price extended losses and traded below the $64,200 level. However, BTC bulls were active near the $63,500 level. A low was formed at $63,427 and the price recently started a fresh increase.
There was a move above the $64,500 and $65,000 resistance levels. The price climbed above the 50% Fib retracement level of the downward move from the $68,240 swing high to the $63,427 low. Besides, there was a break above a key bearish trend line with resistance at $66,000 on the hourly chart of the BTC/USD pair.
Bitcoin price is now trading above $65,500 and the 100 hourly Simple moving average. If the price continues to rise, it could face resistance near the $67,000 level or the 76.4% Fib retracement level of the downward move from the $68,240 swing high to the $63,427 low.
The first key resistance is near the $67,500 level. A clear move above the $67,500 resistance might send the price further higher in the coming sessions. The next key resistance could be $68,000. The next major hurdle sits at $68,500. A close above the $68,500 resistance might spark bullish moves. In the stated case, the price could rise and test the $70,000 resistance.
If Bitcoin fails to recover above the $67,000 resistance zone, it could start another decline. Immediate support on the downside is near the $66,400 level and the 100 hourly Simple moving average.
The first major support is $65,500. The next support is now near $65,000. Any more losses might send the price toward the $63,500 support zone in the near term.
Technical indicators:
Hourly MACD – The MACD is now gaining pace in the bullish zone.
Hourly RSI (Relative Strength Index) – The RSI for BTC/USD is now above the 50 level.
Major Support Levels – $66,400, followed by $65,500.
Major Resistance Levels – $67,000, and $68,000.
[#item_full_content]NewsBTCRead MoreBitcoin’s on-chain activity has shown a sharp slowdown since spot Bitcoin exchange-traded funds (ETFs) launched.…
The broader market held its recent rebound, though liquidity remained thin ahead of Wednesday’s Federal…
These flows represent a bullish bet on volatility rather than a downside hedge or outright…
Based on reports, France’s second-largest banking group has started letting customers trade crypto in its…
QCP notes participation has collapsed while Polymarket sees a shallow easing path, putting the focus…
Bitcoin price struggled to stay above $92,000. BTC is now consolidating gains and might dip…