Bitcoin price started a recovery wave from the $65,500 zone. BTC is now consolidating and might aim for more gains above $69,500.
Bitcoin started a decent recovery wave above the $67,500 zone.
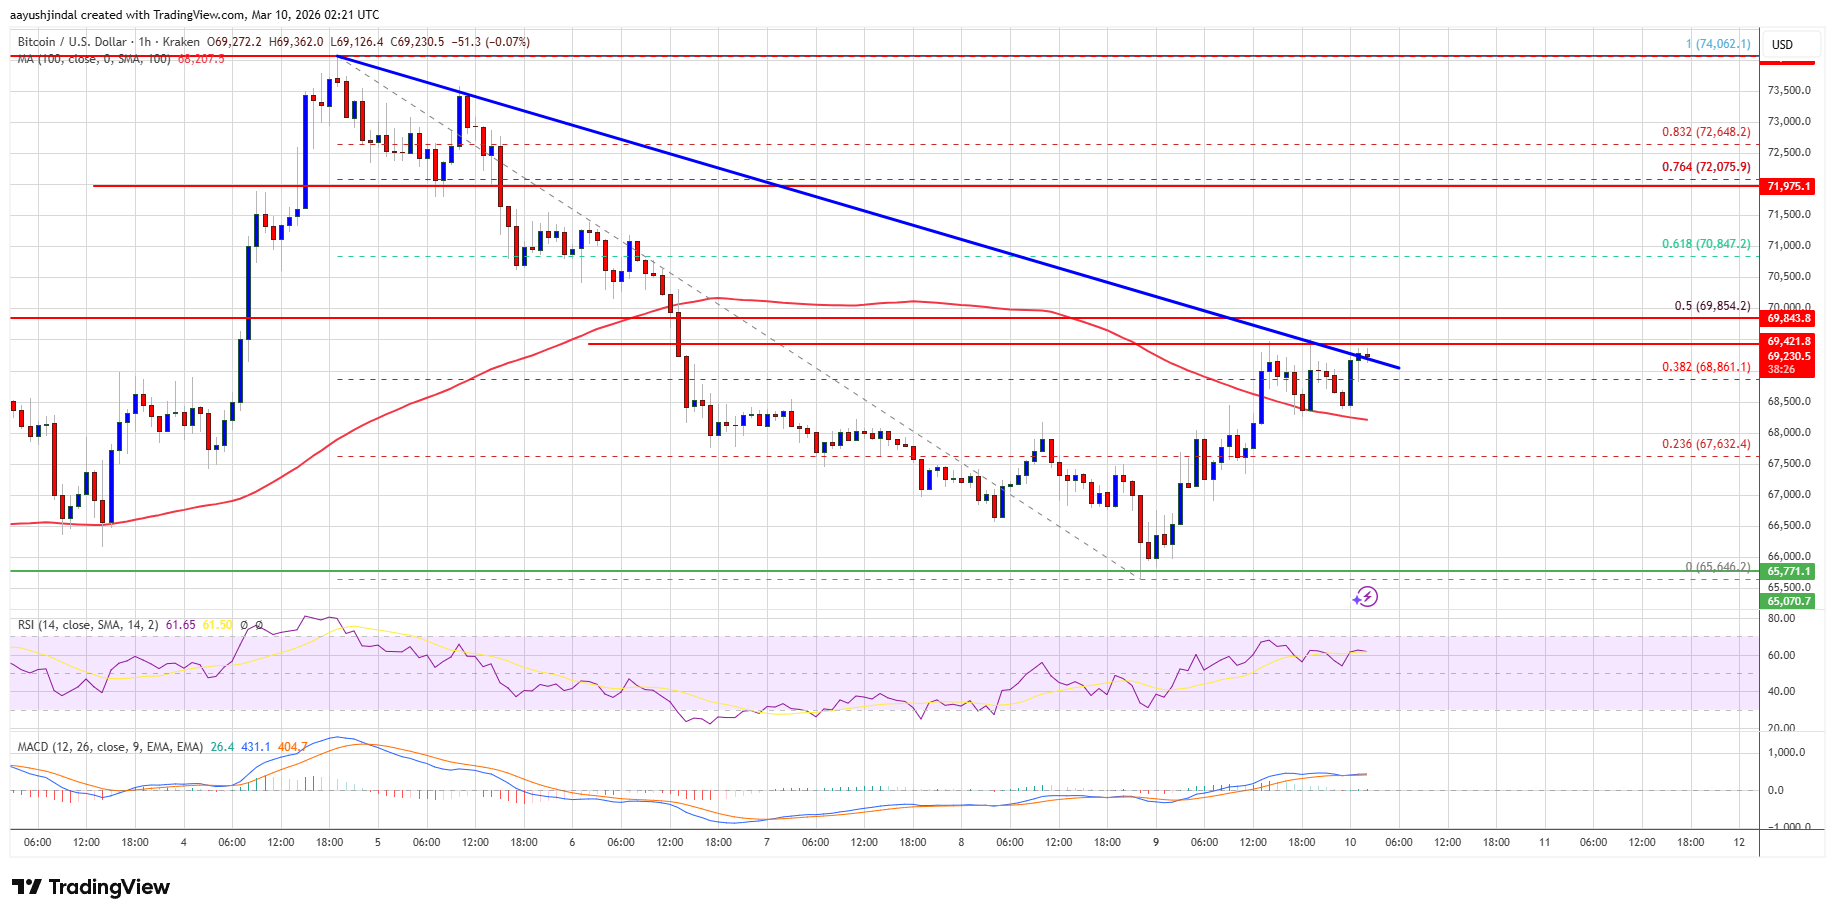
The price is trading above $68,000 and the 100 hourly simple moving average.
There is a key bearish trend line forming with resistance at $69,250 on the hourly chart of the BTC/USD pair (data feed from Kraken).
The pair might dip again if it trades below the $68,500 and $68,000 levels.
Bitcoin price extended its decline and traded below the $66,500 level. BTC tested the $65,500 support zone before the bulls emerged. A low was formed at $65,646, and the price recently started a recovery wave.
The price climbed above the $67,200 and $67,500 resistance levels. The bulls pushed the price above the 23.6% Fib retracement level of the downward move from the $74,062 swing high to the $65,646 low. However, the bears are still active below $70,000.
There is also a key bearish trend line forming with resistance at $69,250 on the hourly chart of the BTC/USD pair. Bitcoin is now trading above $68,500 and the 100 hourly simple moving average.
If the price remains stable above $67,500, it could attempt a fresh increase. Immediate resistance is near the $69,250 level. The first key resistance is near the $69,600 level and the 50% Fib retracement level of the downward move from the $74,062 swing high to the $65,646 low.
A close above the $69,600 resistance might send the price further higher. In the stated case, the price could rise and test the $70,500 resistance. Any more gains might send the price toward the $72,000 level. The next barrier for the bulls could be $72,650.
If Bitcoin fails to rise above the $69,250 resistance zone, it could start another decline. Immediate support is near the $68,500 level. The first major support is near the $68,000 level.
The next support is now near the $67,500 zone. Any more losses might send the price toward the $66,650 support in the near term. The main support now sits at $65,500, below which BTC might struggle to recover in the near term.
Technical indicators:
Hourly MACD – The MACD is now gaining pace in the bullish zone.
Hourly RSI (Relative Strength Index) – The RSI for BTC/USD is now above the 50 level.
Major Support Levels – $68,000, followed by $67,500.
Major Resistance Levels – $69,250 and $69,850.
[#item_full_content]NewsBTCRead MoreStrategy, the company that has built its identity around hoarding Bitcoin, is now sitting on…
BTC rebounded from about $65,000 as crude oil retreated and institutional flows helped stabilize the…
Bitcoin continues to trade below the $70,000 level as the broader crypto market navigates another…
Bitcoin is slipping to a seven‑day low as oil is screaming higher on Iran war…
Bitcoin Magazine Bitcoin Has a Golden Opportunity With AI Agents, It’s Time to Build For…
Bitcoin’s rally back to the mid-$73,000 region did not last long as the leading cryptocurrency’s…