Bitcoin price is rising and now trading above $70,000 resistance zone. BTC could continue to rise toward the $73,000 and $75,000 levels in the near term.
Bitcoin price remained in a positive zone above the $66,500 level.
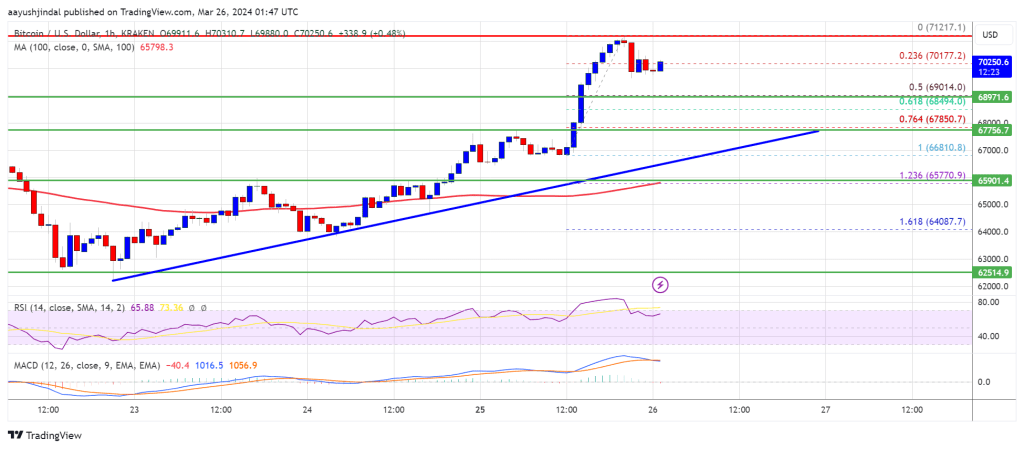
The price is trading above $70,000 and the 100 hourly Simple moving average.
There is a connecting bullish trend line forming with support at $67,500 on the hourly chart of the BTC/USD pair (data feed from Kraken).
The pair could continue to rise if it clears the $71,200 resistance zone.
Bitcoin price remained stable above the $65,000 resistance zone. BTC climbed higher above the $67,500 and $68,000 resistance levels. The bulls even pumped the price above the $68,800 and $70,000 resistance levels.
A new weekly high was formed near $71,217 and the price is now consolidating gains. It is trading near the 23.6% Fib retracement level of the upward move from the $66,810 swing low to the $71,217 high. Bitcoin is also trading above $70,000 and the 100 hourly Simple moving average.
There is also a connecting bullish trend line forming with support at $67,500 on the hourly chart of the BTC/USD pair. The trend line is close to the 76.4% Fib retracement level of the upward move from the $66,810 swing low to the $71,217 high.
Source: BTCUSD on TradingView.com
Immediate resistance is near the $70,500 level. The first major resistance could be $71,200. If there is a clear move above the $71,200 resistance zone, the price could continue to gain strength. In the stated case, the price could even clear the $73,500 resistance zone in the near term. The next key resistance sits at $75,000.
If Bitcoin fails to rise above the $71,200 resistance zone, it could start another decline. Immediate support on the downside is near the $70,000 level.
The first major support is $69,000. The next support sits at $67,800 and the trend line. If there is a close below $67,800, the price could start a drop toward the $66,800 level. Any more losses might send the price toward the $65,500 support zone in the near term.
Technical indicators:
Hourly MACD – The MACD is now losing pace in the bullish zone.
Hourly RSI (Relative Strength Index) – The RSI for BTC/USD is now above the 60 level.
Major Support Levels – $69,000, followed by $67,800.
Major Resistance Levels – $70,500, $71,200, and $73,500.
[#item_full_content]NewsBTCRead MoreBitcoin Magazine Cathie Wood Calls Bitcoin’s 50% Crash a “Victory” as Market Tests New Floor…
NEAR Protocol (NEAR) gained 5.8% and Avalanche (AVAX) climbed 3.6%.Read MoreCoinDesk: Bitcoin, Ethereum, Crypto News…
Bitcoin Magazine Riot Platforms Sells 3,778 Bitcoin in Q1 as Miner Strategy Shifts Toward AI…
Bitcoin Magazine The Bitcoin Treasury Model With a Built-In Valuation Floor There is a version…
Naoris debuts its quantum-resistant mainnet, which uses algorithms approved by the U.S. National Institute of…
Bloomberg senior strategist Mike McGlone has renewed a stark prediction for Bitcoin (BTC), arguing that…