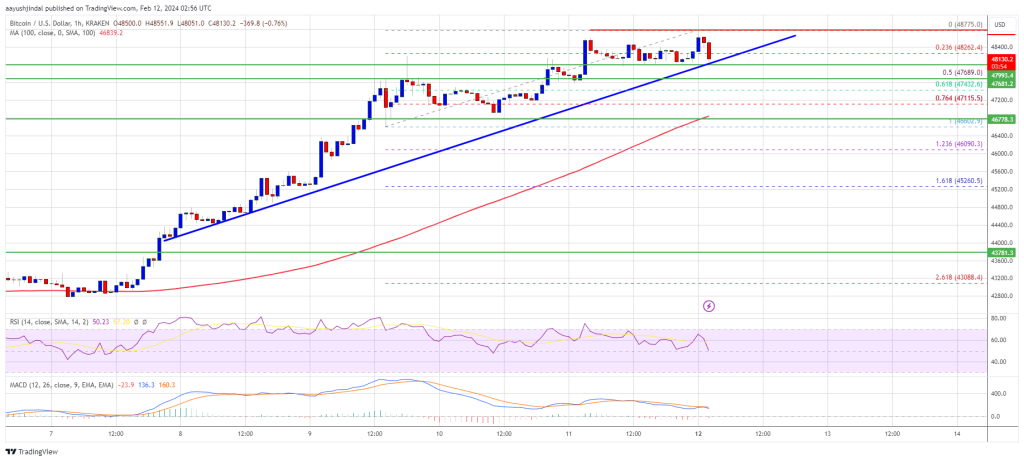
Bitcoin price climbed higher above the $48,000 resistance. BTC tested $48,800 and is currently showing signs of a downside correction.
Bitcoin price climbed higher above the $46,500 and $48,000 resistance levels.
The price is trading above $47,500 and the 100 hourly Simple moving average.
There is a key bullish trend line forming with support at $48,000 on the hourly chart of the BTC/USD pair (data feed from Kraken).
The pair could continue to move up unless there is a close below the $48,000 support.
Bitcoin price started a major increase above the $45,500 resistance zone. BTC cleared a few hurdles near the $46,000 and $47,200 levels to move further into a positive zone.
The bulls gained strength and were able to pump the price above the $48,000 resistance. It tested the $48,800 zone. A new multi-week high was formed near $48,775 and the price is now consolidating gains. There was a minor decline below the $48,500 level.
The price dipped below the 23.6% Fib retracement level of the recent wave from the $46,602 swing low to the $48,775 high. Bitcoin price is now trading above $47,500 and the 100 hourly Simple moving average.
There is also a key bullish trend line forming with support at $48,000 on the hourly chart of the BTC/USD pair. Immediate resistance is near the $48,500 level. The next key resistance could be $48,800, above which the price could start another decent increase.
Source: BTCUSD on TradingView.com
The next stop for the bulls may perhaps be $49,250. A clear move above the $49,250 resistance could send the price toward the $49,800 resistance. The next resistance could be near the $50,000 level.
If Bitcoin fails to rise above the $48,800 resistance zone, it could start a downside correction. Immediate support on the downside is near the $48,000 level or the trend line.
The first major support is $47,650 and the 50% Fib retracement level of the recent wave from the $46,602 swing low to the $48,775 high. If there is a close below $47,650, the price could gain bearish momentum. In the stated case, the price could dive toward the $46,500 support.
Technical indicators:
Hourly MACD – The MACD is now losing pace in the bullish zone.
Hourly RSI (Relative Strength Index) – The RSI for BTC/USD is now near the 50 level.
Major Support Levels – $48,000, followed by $47,650.
Major Resistance Levels – $48,500, $48,800, and $50,000.
[#item_full_content]NewsBTCRead MoreYour day-ahead look for July 10, 2026Read MoreCoinDesk: Bitcoin, Ethereum, Crypto News and Price Data[#item_full_content]
The bitcoin treasury company is working with JPYC and Progmat to explore tokenized credit products…
Bitcoin has spent 307 days in the $60,000-$70,000 range, the third longest consolidation in any…
Spot bitcoin funds lost about $95 million on Thursday and ether funds roughly $52 million,…
A smoother long-term MACD just flipped bullish, pointing to more upside. Here are key levels…
Bitcoin is up 4.2% over seven days that contained an oil shock, a bond selloff…