Bitcoin price is still struggling to settle above the $68,000 resistance. BTC is now consolidating and might drop again toward the $63,500 support.
Bitcoin price is struggling to clear the $68,000 and $68,500 levels.
The price is trading above $66,000 and the 100 hourly Simple moving average.
There is a key rising channel forming with resistance near $68,200 on the hourly chart of the BTC/USD pair (data feed from Kraken).
The pair could start another decline and trade toward $63,500 support zone.
Bitcoin price recovered most losses and settled above the $65,000 level. However, BTC seems to be struggling to clear the $68,000 and $68,500 levels, unlike Ethereum.
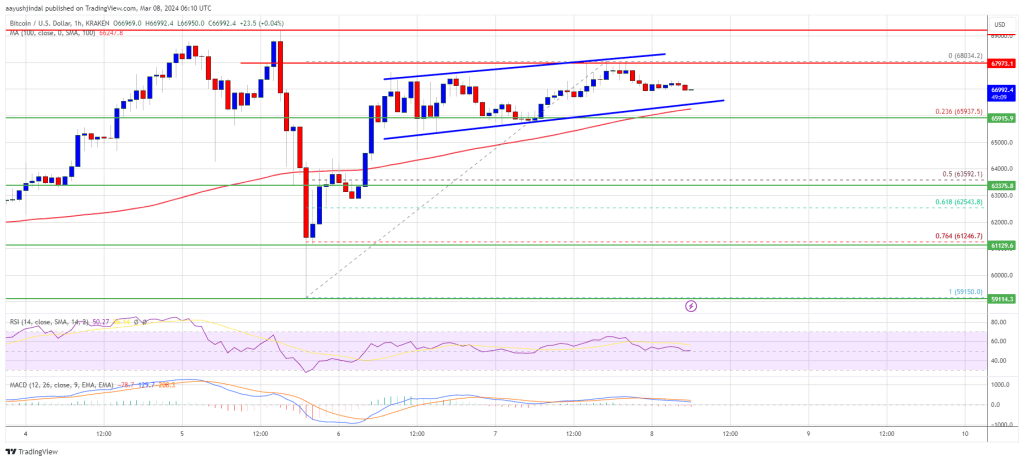
The recent high was formed at $68,034 and the price is now consolidating gains. It is trading above the 23.6% Fib retracement level of the upward wave from the $59,150 swing low to the $68,034 high. There is also a key rising channel forming with resistance near $68,200 on the hourly chart of the BTC/USD pair.
Bitcoin is still trading above $66,000 and the 100 hourly Simple moving average. Immediate resistance is near the $67,500 level. The next key resistance could be $68,000, above which the price could rise toward the $68,500 resistance zone.
Source: BTCUSD on TradingView.com
If there is a clear move above the $68,500 resistance zone, the price could even attempt a move above the $69,200 resistance zone. Any more gains might send the price toward the $70,000 level.
If Bitcoin fails to rise above the $68,000 resistance zone, it could start another downside correction. Immediate support on the downside is near the $66,550 level and the channel trend line.
The first major support is $66,000. If there is a close below $66,000, the price could start a decent pullback toward the 50% Fib retracement level of the upward wave from the $59,150 swing low to the $68,034 high at $63,500. Any more losses might send the price toward the $62,500 support zone.
Technical indicators:
Hourly MACD – The MACD is now gaining pace in the bearish zone.
Hourly RSI (Relative Strength Index) – The RSI for BTC/USD is now near the 50 level.
Major Support Levels – $66,550, followed by $66,000.
Major Resistance Levels – $67,500, $68,000, and $68,500.
[#item_full_content]NewsBTCRead MoreTL;DR The supplied setup highlights resistance near the $61,000 area and support/liquidation interest around $58,200.Bitcoin…
TL;DR Mysten Labs’ Hashi framework aims to bring native Bitcoin collateral into Sui DeFi without…
TL;DR The supplied pack reports $445 million in outflows from U.S. spot Bitcoin ETFs for…
TL;DR Bitcoin is consolidating near $60,326.78 according to the supplied market check.The highlighted setup focuses…
TL;DR Bitcoin recently rebounded from the $58,000 area and was validated near $60,326.78 in the…
For years, investors had valued the firm well above its bitcoin holdings, giving Strategy massive…