Bitcoin price is still struggling to settle above the $68,000 resistance. BTC is now consolidating and might drop again toward the $63,500 support.
Bitcoin price is struggling to clear the $68,000 and $68,500 levels.
The price is trading above $66,000 and the 100 hourly Simple moving average.
There is a key rising channel forming with resistance near $68,200 on the hourly chart of the BTC/USD pair (data feed from Kraken).
The pair could start another decline and trade toward $63,500 support zone.
Bitcoin price recovered most losses and settled above the $65,000 level. However, BTC seems to be struggling to clear the $68,000 and $68,500 levels, unlike Ethereum.
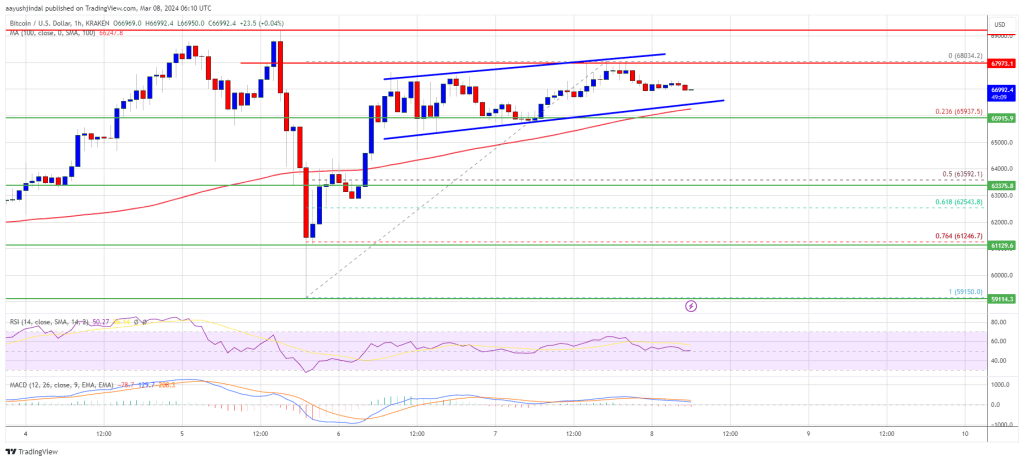
The recent high was formed at $68,034 and the price is now consolidating gains. It is trading above the 23.6% Fib retracement level of the upward wave from the $59,150 swing low to the $68,034 high. There is also a key rising channel forming with resistance near $68,200 on the hourly chart of the BTC/USD pair.
Bitcoin is still trading above $66,000 and the 100 hourly Simple moving average. Immediate resistance is near the $67,500 level. The next key resistance could be $68,000, above which the price could rise toward the $68,500 resistance zone.
Source: BTCUSD on TradingView.com
If there is a clear move above the $68,500 resistance zone, the price could even attempt a move above the $69,200 resistance zone. Any more gains might send the price toward the $70,000 level.
If Bitcoin fails to rise above the $68,000 resistance zone, it could start another downside correction. Immediate support on the downside is near the $66,550 level and the channel trend line.
The first major support is $66,000. If there is a close below $66,000, the price could start a decent pullback toward the 50% Fib retracement level of the upward wave from the $59,150 swing low to the $68,034 high at $63,500. Any more losses might send the price toward the $62,500 support zone.
Technical indicators:
Hourly MACD – The MACD is now gaining pace in the bearish zone.
Hourly RSI (Relative Strength Index) – The RSI for BTC/USD is now near the 50 level.
Major Support Levels – $66,550, followed by $66,000.
Major Resistance Levels – $67,500, $68,000, and $68,500.
[#item_full_content]NewsBTCRead MoreBitcoin is navigating one of its deepest conviction zones yet, a phase that tests nerves…
Glassnode data is showing buying across all cohorts of bitcoin holders.Read MoreCoinDesk: Bitcoin, Ethereum, Crypto…
The price of Bitcoin experienced one of the most bearish periods in its history over…
Crypto expert Tony Severino has opined that Bitcoin isn’t just showing signs of a yearly…
Arthur Hayes, co‑founder of BitMEX, has pointed to hedging tied to BlackRock’s iShares Bitcoin Trust…
Crypto sentiment was hit as Gemini plans to close operations in several regions and cut…