Bitcoin price is attempting a recovery wave above the $66,500 resistance. BTC must clear the $70,000 resistance to continue higher in the near term.
Bitcoin is facing many hurdles near the $69,500 and $70,000 levels.
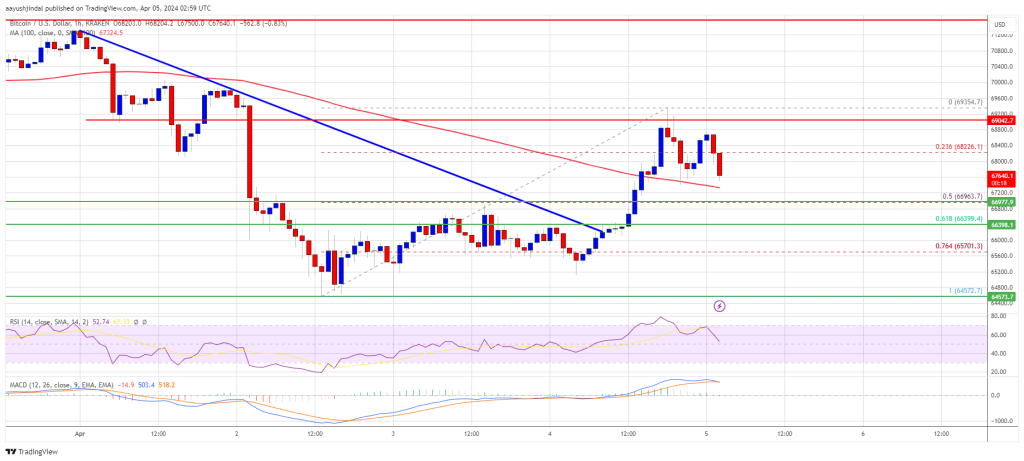
The price is trading above $67,000 and the 100 hourly Simple moving average.
There was a break above a key bearish trend line with resistance at $66,350 on the hourly chart of the BTC/USD pair (data feed from Kraken).
The pair could start another increase if it stays above the $67,000 support zone.
Bitcoin price found support near the $64,500 zone and started a recovery wave. BTC was able to rise above the $66,500 and $67,000 resistance levels to move into a short-term positive zone.
There was a break above a key bearish trend line with resistance at $66,350 on the hourly chart of the BTC/USD pair. The pair even spiked above the $69,000 zone. A high was formed at $69,354 and the price is now consolidating gains.
It traded below the 23.6% Fib retracement level of the upward move from the $64,572 swing low to the $69,352 high. Bitcoin is now trading above $67,000 and the 100 hourly Simple moving average.
Immediate resistance is near the $68,250 level. The first major resistance could be $69,350. The main resistance now sits at $70,000. If there is a clear move above the $70,000 resistance zone, the price could start a fresh increase. In the stated case, the price could rise toward $71,200.
Source: BTCUSD on TradingView.com
The next major resistance is near the $72,000 zone. Any more gains might send Bitcoin toward the $73,500 resistance zone in the near term.
If Bitcoin fails to rise above the $69,350 resistance zone, it could start another decline. Immediate support on the downside is near the $67,200 level.
The first major support is $67,000 or the 50% Fib retracement level of the upward move from the $64,572 swing low to the $69,352 high. The next support sits at $66,400. If there is a close below $66,400, the price could start a drop toward the $65,500 level. Any more losses might send the price toward the $64,500 support zone in the near term.
Technical indicators:
Hourly MACD – The MACD is now losing pace in the bullish zone.
Hourly RSI (Relative Strength Index) – The RSI for BTC/USD is now declining toward the 50 level.
Major Support Levels – $67,200, followed by $67,000.
Major Resistance Levels – $69,350, $70,000, and $71,200.
[#item_full_content]NewsBTCRead MoreAcross many of the most well-known ecosystems like Bitcoin, Ethereum, and Solana, responses are diverging…
The recent surge in oil and gas prices has driven up inflation expectations, causing markets…
In the last week, Bitcoin prices fell to around $65,000, resulting in a net loss…
The search giant set a corporate deadline to migrate all authentication services to quantum-resistant cryptography,…
The Bitcoin price has been trading below $100,000 for months now, and there has been…
The latest Bitcoin (BTC) price drop has raised concerns about the cryptocurrency’s upcoming performance, with…